Continuing on with GEDmatch’s AutoCluster Endo tool, as I play around with the settings. I kept adjusting my mother’s kit and could not find the right settings. Basically, I could not produce any clusters simply based on the settings expected with non-endogamous populations.
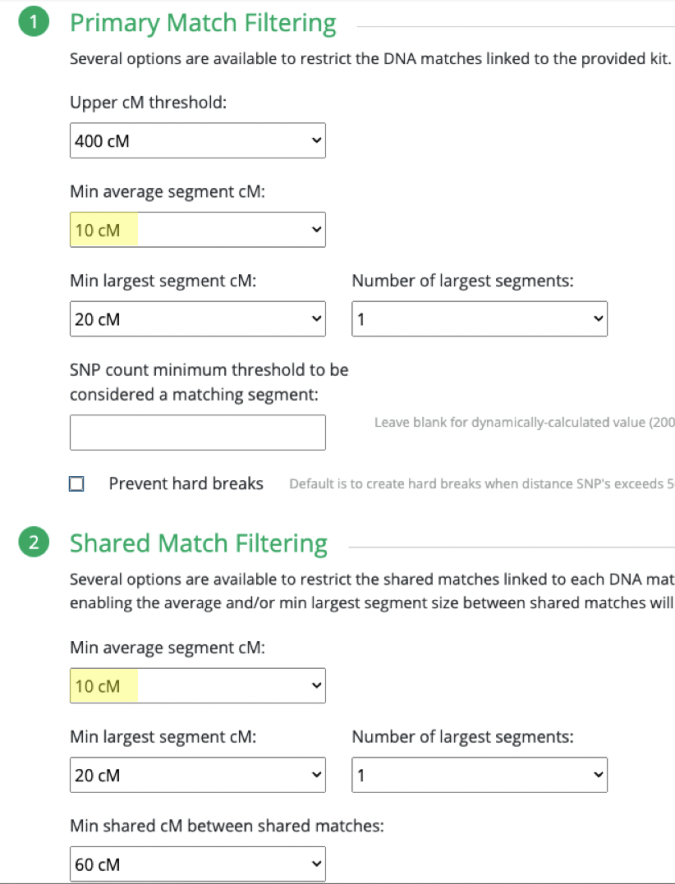
What I ended up doing was adjusting the Min average segment cM lower and lower (from 15cM down to 9cM) each time until I got it right at that threshold where I knew it would produce the larger (endogamous) cluster.
I repeated the same thing under Shared Match Filter by selecting 9cM (screen shot shows 10cM which is what I used for myself) for Min average segment cM
So with my mother, it seems that she currently does not have any decent size matches to cluster. I would have noticed that since I normally would sort her matches (as well as my own) by Largest Segment size.
Interestingly with my own matches, I noticed something unique and unexpected and I know it had to do with the Shared Match Filtering which I will go over in a bit.
But first I want to stress the importance of knowing what the Min average segment cM would be and why. Again, given the past 11 years I have been trying to weed out all endogamous matches, and I have noticed that the largest segment size for many of the matches rarely exceeds 12cM. I noticed this at FTDNA, 23andMe and at GEDmatch.
I was able to go through my Ancestry matches, also the same for my mother and one of my cousins and have seen what that average size looks like. So taking a closer look at what that looks like (using Ancestry matches as an example).
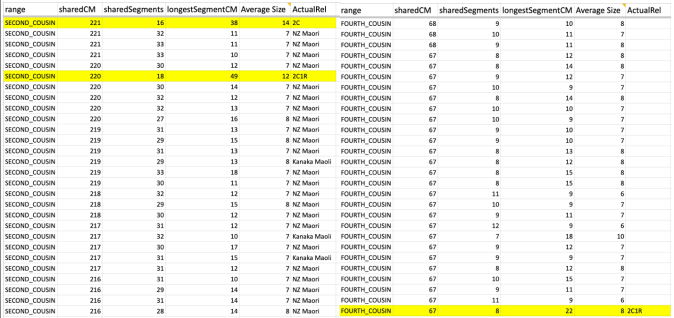
Whether it is in the predicted 2nd cousin range, 3rd cousin, 4th cousin, or distant cousin, the average size you will see (based on the total shared cM divided by the number of segments) is around 8cM. I identified my endogamous matches in the closer (2C range), but never completed the entire lengthy list going down to the 4C range except for the known relationships where it is highlighted in yellow.
I highlighted an actual 2C1R who falls in that predicted 4C range (remember that at the 3C level, you will not match about 10% of them) and whose average segment size is 8cM. While those numbers (total shared divided by #segments) seem to be similar to the other matches in that range, the longest segment size is more than 20cM. That is something that we rarely get, at least with this closely predicted range. This relative does have a few other lines or branches that are of the same endogamous background, which explains why there are many segments.
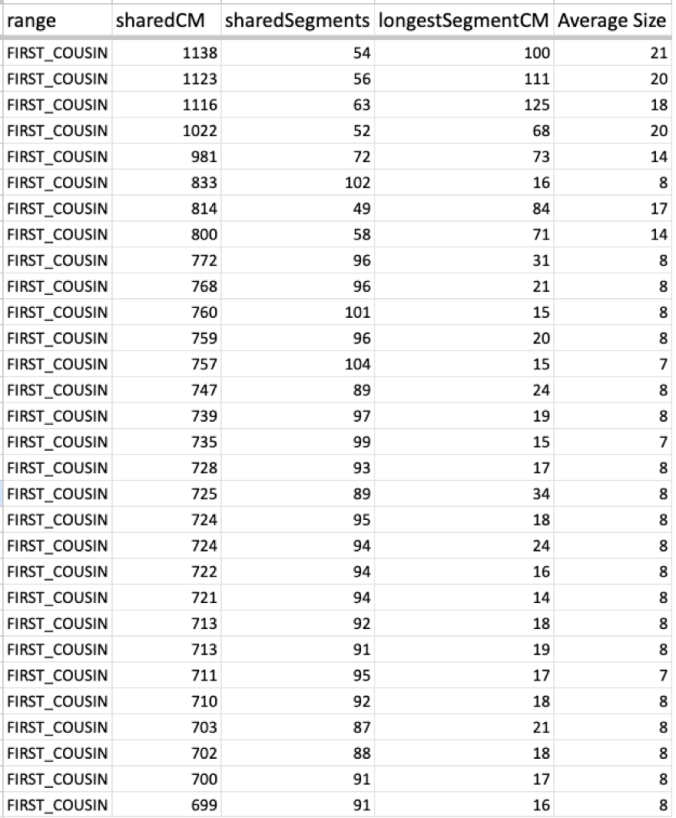
Now take a look at one of my cousin’s average size segments even with their endogamous matches predicted to be in the 1st cousin range.
That average segment size is still 8cM due to the number of segments for that given total shared cM. These are a cousin’s matches so I did not take the time to highlight and identify their known relatives, but it should be obvious which ones are the true, close relatives.
Okay, now that the average segment size is defined, and identified why that number is what we see, you have an idea what number to utilize (assuming that your average segment size is also below 12cM) in this tool and what amounts would remove all the endogamous matches.
These are the results for my matches utilizing the 10cM average size segment. It’s not too small, although I could have easily made that slightly larger, like 15cM.
(Sidenote, you can easily zoom in & out of the cluster. So having a lot of matches in a cluster and trying to reduce it is a plus!)
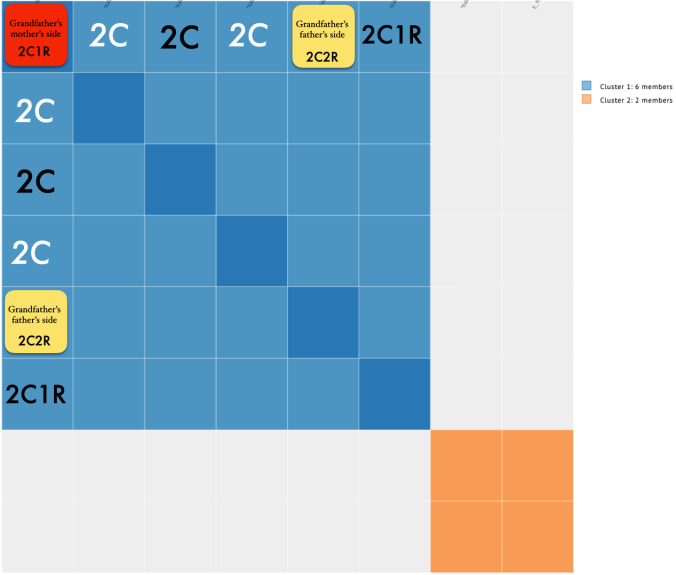
So it divided my grandfather’s matches (blue) from my grandmother’s matches (orange). But if I took a careful look at just my grandfather’s side, this is what I noticed.
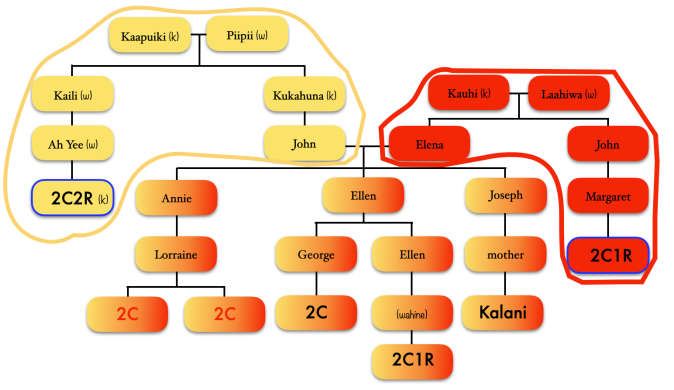
Focusing on the blue cluster first, I have a pair of 2nd cousins who are siblings (indicated in white) and another 2nd cousin and her 1st cousin 1x removed (my 2C1R) in the blue cluster which is my grandfather’s side. The two white 2C’s grandmother, and the other 2C’s grandmother (the 2C1R’s great-grandmother) were sisters to my grandfather.
Then we have the 2C1R in red whose grandfather was a brother to my grandfather’s mother. The (yellow) 2C2R was a 2C to my grandfather. But here is a clearer picture of how each match is connected to me and each other.
[“k” is kāne or male, “w” is wahine or female]
So going back to that cluster (above), you can see where the problem is where the 2C2R on my grandfather’s father’s side is matching the 2C1R on my grandfather’s mother’s side.
Ideally, the clusters should be separated by pairs of ancestors.
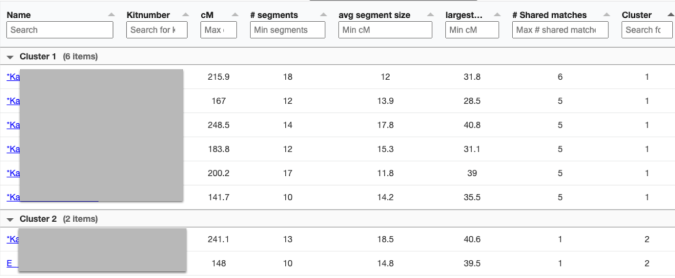
Looking at the details of the two clusters, I can see why it was able to separate my grandmother’s matches from my grandfather’s. Remember, I normally do not get any separation when it comes to my maternal side. Even with my paternal side being a different population, I have paternal relatives whose other side belongs to the same endogamous (Kanaka Maoli) population and can generate gray marks indicating that they are part of more than a single cluster. Some other endogamous populations will have a lot of these, maybe you might too with your matches.
Only 2 other matches are making up the second cluster. My 2C and a 3C1R to both me and my 2C. I share with the 2C a total of 241cM across 13 segments, and the largest segment 40cM. With my 3C1R I share a total of 148cM across 10 segments, and largest segment of 40cM. Comparing those two cousins with each other, they share a total of 108cM across 10 segments, with the largest segment being 26cM.
Since I selected 20cM for the minimum largest segment, it pulled up these actual relatives of mine, all of whom have the largest segment size as small as 29cM, and as large as 41cM. These high settings helped remove the endogamous matches. Not only that, it was able to at least separate my grandmother’s side from my grandfather’s side. What is important to know is that at GEDmatch I do not have any close enough relatives on my grandmother’s father’s side, only on her mother’s side. Maybe if I had a few close relatives, we could have seen how my grandmother’s father’s side would mix with her mother’s side as well? Who knows. It is just amazing to me that this tool, given the opportunity to adjust these parameters could help break the matches into actual clusters. I am speaking from an endogamous perspective and how we have to deal with the high amount of closely predicted shared matches.


Very interesting analysis, Kalani. I think the last chart with your 2C2R and 2C1R is showing the big weakness of this cluster analysis vs DNA segment triangulation. The big difference is that in DNA segment triangulation, you will always have one (!) common ancestor who contributed to the ancestral DNA segment that is identified. Now with your case and other endogamous cases, there are several matching segments that are IBD but they are all thrown together in one visualization (meaning 2C2R matches 2C1R). Also, the DNA segment triangulation is using all relationships between each member of the DNA triangulated group, hence you’re able to identify which ancestor can be ruled out and thus reduce your search area for the common ancestors. From what I see with my own users with AJ ethnicity, it works quite well and the biggest problem is rather the missing written records after a couple of generations.
LikeLike
Yes, you are exactly right! This is where cluster analysis is different with actual triangulation which utilizes a matching segment. Granted that with triangulated segments, that does not work for us from what I’ve seen a lot or random, small segments. But also given those parameters allowing us to adjust the size of the shared segments, average sized segments (big game changer) and longest segment size, all helpful.
Like you, the real issue with mapping out segments & tiangulated segments is the ability to support that with documentation. Our records are limited once you go to the mid 1800s.
LikeLike