In my last blog entry “Tiny Segments from the Same Common Ancestors“, I began comparing Western Polynesians (Samoans & Tongans), and Eastern Polynesians (Maori and Hawaiians), and compared them to each other in order to show how the tiny segments appeared like missing teeth on the chromosome browser. Now I will show how people compare to each other based on total centimorgans and their longest block (FTDNA).
First I compare Tongans and Samoans to each other. Both Samoans and Tongans are Western Polynesians and are the most diverse. Polynesian settlement began in the west in the Tonga/Samoa/Fiji area. I mentioned this in a previous entry “Loss of heterozygosity – from Western Polynesia to Eastern Polynesia.”
T = Tongan
S = Samoan
– = no match
I colored it to make it easier to see or compare Tongans to Tongans in light green, and Samoans to Samoans in light blue. The ones not colored are comparing Samoans to Tongans. The top number is the total shared in centimorgans, while the bottom number is the longest block (largest segment). The average totals seem to be between the upper 200s to mid-300s. The lower numbers (in the hundreds) is due to the fact that the person is admixed. In other words, they are not pure Samoan/Tongan, and usually have some European ancestry.

Comparing Tongans to themselves:
TOTAL
lowest – 117cM (part Tongan)
highest – 340cM
average – 258cM
LONGEST BLOCK
lowest – 5.79cM
highest – 10.51cM
average – 8.54cM
Comparing Samoans to themselves:
TOTAL
lowest – 165cM (part Samoan)
highest – 366cM
average – 271cM
LONGEST BLOCK
lowest – 5.66cM
highest – 16.54cM
average – 9.20cM
Comparing Tongans to Samoans:
TOTAL
lowest – 143cM
highest – 321cM
average – 248cM
LONGEST BLOCK
lowest – 5.79cM
highest – 11.07cM
average – 7.81cM
This is what it looks like when I compare those same Tongans and Samoans to Hawaiians and Maoris who are Eastern Polynesians.
H = Hawaiian
M = Maori
T = Tongan
S = Samoan
? = unable to determine if a match
– = no match
In this graph, I again colored it for easy comparison. Hawaiian vs. Tongans in light brown, Hawaiians vs. Samoans in golden yellow, Maoris vs. Tongans in pink, and Maoris vs. Samoans in light green.

Most of the Eastern Polynesians are admixed except for two Hawaiians and one Maori. But those that are admixed are still more than 75% Polynesian which still keeps the totals fairly high as you can clearly see it still above one hundred with the exception of one Hawaiian who is admixed to the Tongan that is admixed. In fact, that admixed Tongan only shares with one Hawaiian and one Maori, both less than 100cM. Yet their longest block still falls within the range.
Comparing Hawaiians to Tongans:
TOTAL
lowest – 72cM
highest – 341cM
average – 199cM
LONGEST BLOCK
lowest – 5.34cM
highest – 12.12cM
average – 7.94cM
Comparing Hawaiians to Samoans:
TOTAL
lowest – 135cM
highest – 314cM
average – 213cM
LONGEST BLOCK
lowest – 5.09cM
highest – 11.50cM
average -7.57cM
Comparing Maoris to Tongans:
TOTAL
lowest – 68cM
highest – 240cM
average – 202cM
LONGEST BLOCK
lowest – 5.31cM
highest – 10.94cM
average – 7.87cM
Comparing Maoris to Samoans:
TOTAL
lowest – 147cM
highest – 278cM
average – 229cM
LONGEST BLOCK
lowest – 5.28cM
highest – 10.94cM
average -7.81cM
When looking at the average, it seems to be consistent as far as comparing Eastern Polynesians to any Western Polynesian. However that changes drastically when comparing Eastern Polynesians to themselves.
H = Hawaiian
M = Maori
? = unable to determine if a match
– = no match
I colored Hawaiians in light blue and Maoris in light green when comparing to themselves. The non-colored portion is when they one group is compared to the other.

Comparing Hawaiians to Hawaiians:
TOTAL
lowest – 225cM
highest – 780cM
average – 463cM
LONGEST BLOCK
lowest – 8.45cM
highest – 23.58cM
average -14.90cM
Comparing Maoris to Maoris:
TOTAL
lowest – 581cM
highest – 694cM
average – 641cM
LONGEST BLOCK
lowest – 12.51cM
highest – 19.98cM
average -16.66cM
Comparing Maoris to Hawaiians:
TOTAL
lowest – 291cM
highest – 773cM
average – 514cM
LONGEST BLOCK
lowest – 8.98cM
highest – 29.68cM
average -16.20cM
So to recap, showing just the average total shared and the average longest block size: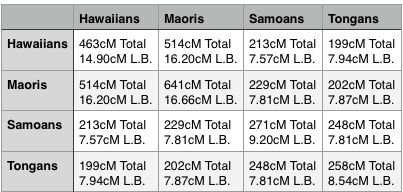
Although I used only 3 Maoris compared to 8 Hawaiians, it was based on the top matches to my mother. There were a few more Maoris but I did not have access to their data and that would have allowed more “?” in the charts. But as we can see, the Western Polynesians tend to have lower totals since they are more diverse unlike the Eastern Polynesians. More admixed Polynesians will result in lower totals, but the longest block is not that much difference from those not admixed.
In the future I will probably attempt to look at admixed Polynesians and compare them to show the average longest block sizes compared to those not admixed.


