AutoCluster Endogamy tool at GEDmatch.com (Part 3)

Continuing on with GEDmatch’s AutoCluster Endo tool, as I play around with the settings.  I kept adjusting my mother’s kit and could not find the right settings.  Basically, I could not produce any clusters simply based on the settings expected with non-endogamous populations.

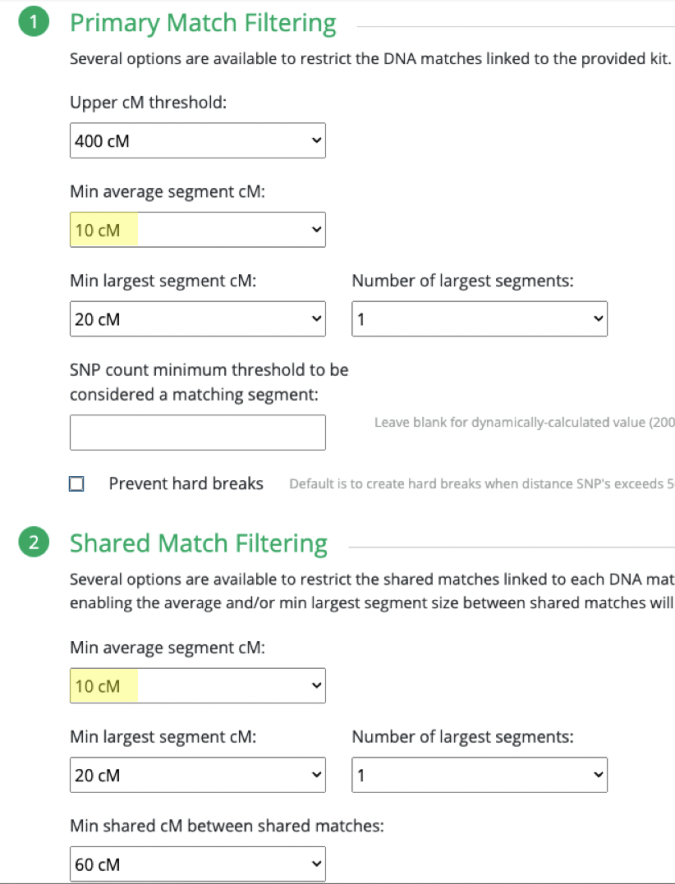
What I ended up doing was adjusting the Min average segment cM lower and lower (from 15cM down to 9cM) each time until I got it right at that threshold where I knew it would produce the larger (endogamous) cluster.

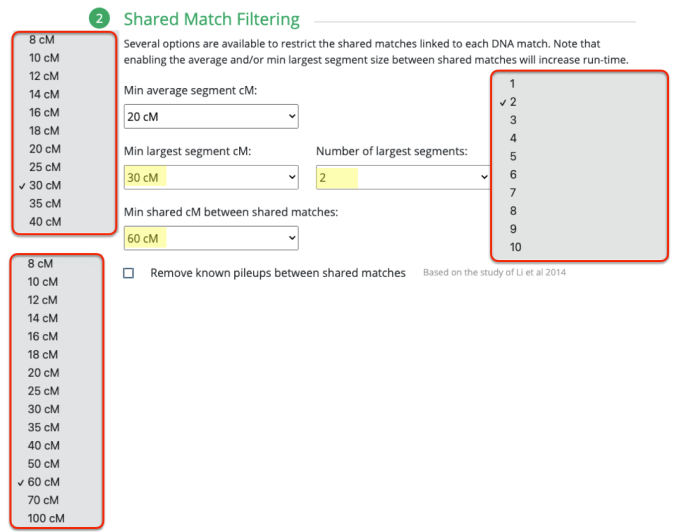
I repeated the same thing under Shared Match Filter by selecting 9cM (screen shot shows 10cM which is what I used for myself) for Min average segment cM

So with my mother, it seems that she currently does not have any decent size matches to cluster.  I would have noticed that since I normally would sort her matches (as well as my own) by Largest Segment size.

Interestingly with my own matches, I noticed something unique and unexpected and I know it had to do with the Shared Match Filtering which I will go over in a bit.

But first I want to stress the importance of knowing what the Min average segment cM would be and why.  Again, given the past 11 years I have been trying to weed out all endogamous matches, and I have noticed that the largest segment size for many of the matches rarely exceeds 12cM.  I noticed this at FTDNA, 23andMe and at GEDmatch.

I was able to go through my Ancestry matches, also the same for my mother and one of my cousins and have seen what that average size looks like.  So taking a closer look at what that looks like (using Ancestry matches as an example).

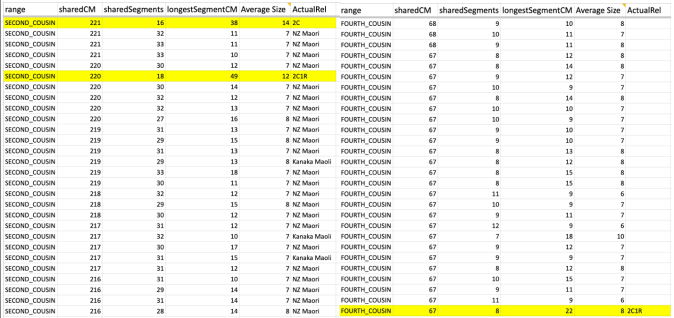
Whether it is in the predicted 2nd cousin range, 3rd cousin, 4th cousin, or distant cousin, the average size you will see (based on the total shared cM divided by the number of segments) is around 8cM.  I identified my endogamous matches in the closer (2C range), but never completed the entire lengthy list going down to the 4C range except for the known relationships where it is highlighted in yellow.

I highlighted an actual 2C1R who falls in that predicted 4C range (remember that at the 3C level, you will not match about 10% of them) and whose average segment size is 8cM.  While those numbers (total shared divided by #segments) seem to be similar to the other matches in that range, the longest segment size is more than 20cM.  That is something that we rarely get, at least with this closely predicted range.  This relative does have a few other lines or branches that are of the same endogamous background, which explains why there are many segments.

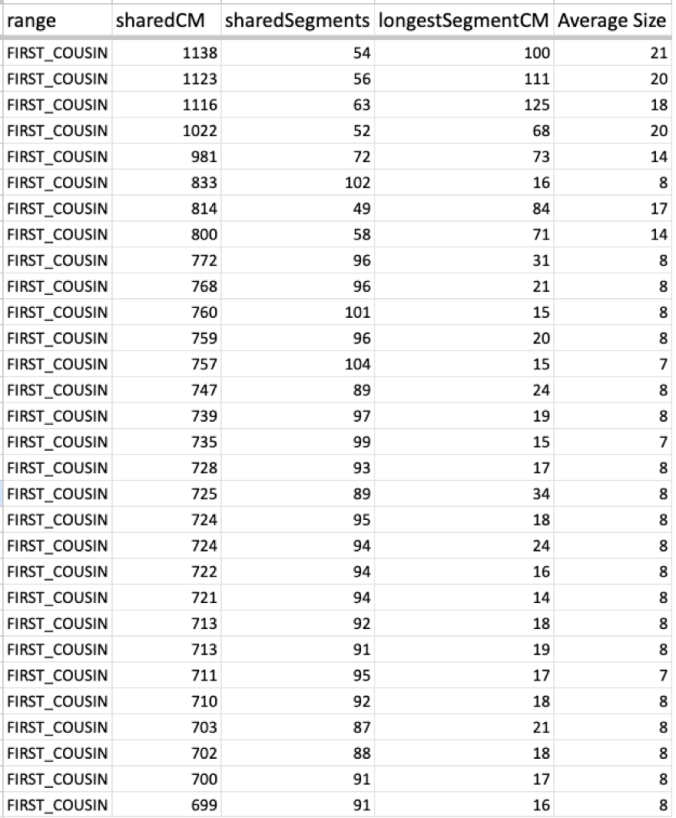
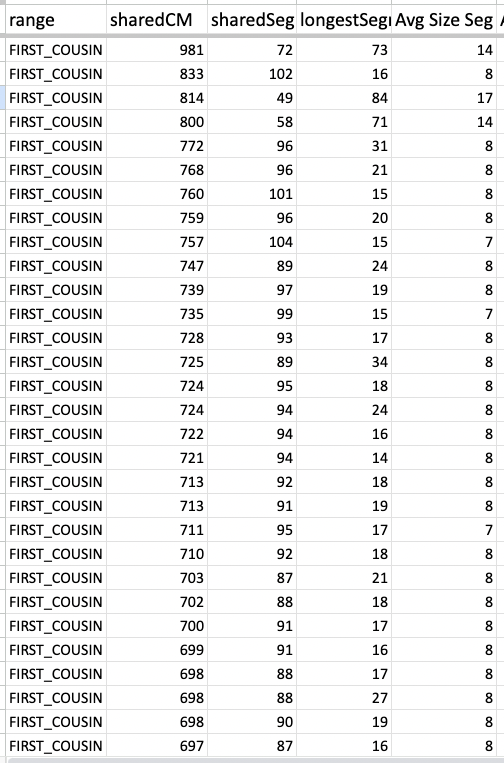
Now take a look at one of my cousin’s average size segments even with their endogamous matches predicted to be in the 1st cousin range.

That average segment size is still 8cM due to the number of segments for that given total shared cM.  These are a cousin’s matches so I did not take the time to highlight and identify their known relatives, but it should be obvious which ones are the true, close relatives.

Okay, now that the average segment size is defined, and identified why that number is what we see, you have an idea what number to utilize (assuming that your average segment size is also below 12cM) in this tool and what amounts would remove all the endogamous matches.

These are the results for my matches utilizing the 10cM average size segment.  It’s not too small, although I could have easily made that slightly larger, like 15cM.

(Sidenote, you can easily zoom in & out of the cluster.  So having a lot of matches in a cluster and trying to reduce it is a plus!)

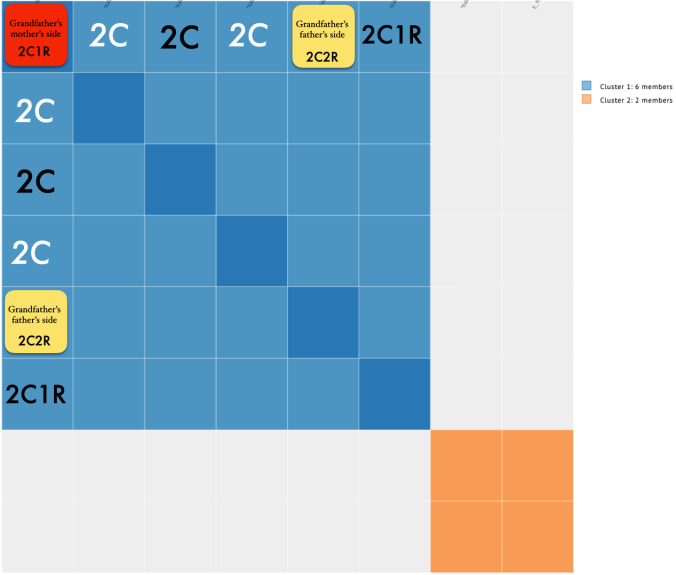
So it divided my grandfather’s matches (blue) from my grandmother’s matches (orange).  But if I took a careful look at just my grandfather’s side, this is what I noticed.

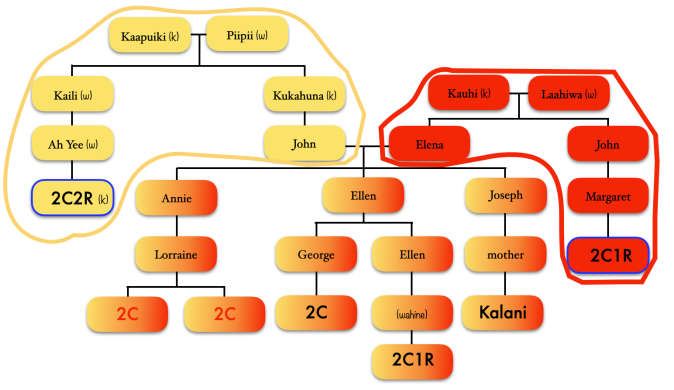
Focusing on the blue cluster first, I have a pair of 2nd cousins who are siblings (indicated in white) and another 2nd cousin and her 1st cousin 1x removed (my 2C1R) in the blue cluster which is my grandfather’s side.  The two white 2C’s grandmother, and the other 2C’s grandmother (the 2C1R’s great-grandmother) were sisters to my grandfather.

Then we have the 2C1R in red whose grandfather was a brother to my grandfather’s mother.  The (yellow) 2C2R was a 2C to my grandfather.  But here is a clearer picture of how each match is connected to me and each other.

[“k” is kāne or male, “w” is wahine or female]

So going back to that cluster (above), you can see where the problem is where the 2C2R on my grandfather’s father’s side is matching the 2C1R on my grandfather’s mother’s side.

Ideally, the clusters should be separated by pairs of ancestors.


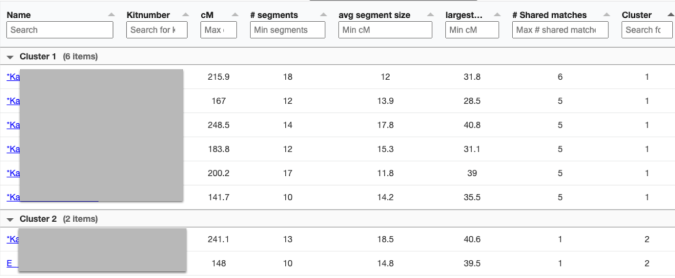
Looking at the details of the two clusters,  I can see why it was able to separate my grandmother’s matches from my grandfather’s.  Remember, I normally do not get any separation when it comes to my maternal side.  Even with my paternal side being a different population, I have paternal relatives whose other side belongs to the same endogamous (Kanaka Maoli) population and can generate gray marks indicating that they are part of more than a single cluster.  Some other endogamous populations will have a lot of these, maybe you might too with your matches.

Only 2 other matches are making up the second cluster.  My 2C and a 3C1R to both me and my 2C.  I share with the 2C a total of 241cM across 13 segments, and the largest segment 40cM.  With my 3C1R I share a total of 148cM across 10 segments, and  largest segment of 40cM.  Comparing those two cousins with each other, they share a total of 108cM across 10 segments, with the largest segment being 26cM.

Since I selected 20cM for the minimum largest segment, it pulled up these actual relatives of mine, all of whom have the largest segment size as small as 29cM, and as large as 41cM.  These high settings helped remove the endogamous matches.  Not only that, it was able to at least separate my grandmother’s side from my grandfather’s side.  What is important to know is that at GEDmatch I do not have any close enough relatives on my grandmother’s father’s side, only on her mother’s side.  Maybe if I had a few close relatives, we could have seen how my grandmother’s father’s side would mix with her mother’s side as well?  Who knows.  It is just amazing to me that this tool, given the opportunity to adjust these parameters could help break the matches into actual clusters.  I am speaking from an endogamous perspective and how we have to deal with the high amount of closely predicted shared matches.
AutoCluster Endogamy tool at GEDmatch.com (Part 2)

In my last blog entry  AutoCluster Endogamy tool at GEDmatch.com (Part 1), I covered briefly about the settings that are adjustable when ready to produce clusters and what is suggested for Polynesians. I also mentioned Leah Larkin referring to different levels or degrees of endogamy based on the average size segment and given that size, what works best or how to approach your DNA matches.  I had to play around with it quite a bit in order to get decent clusters.

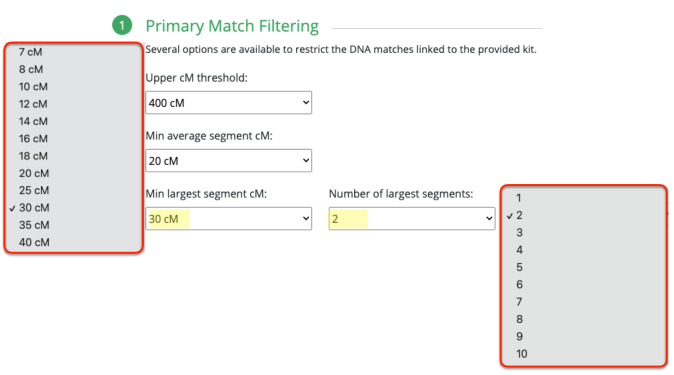
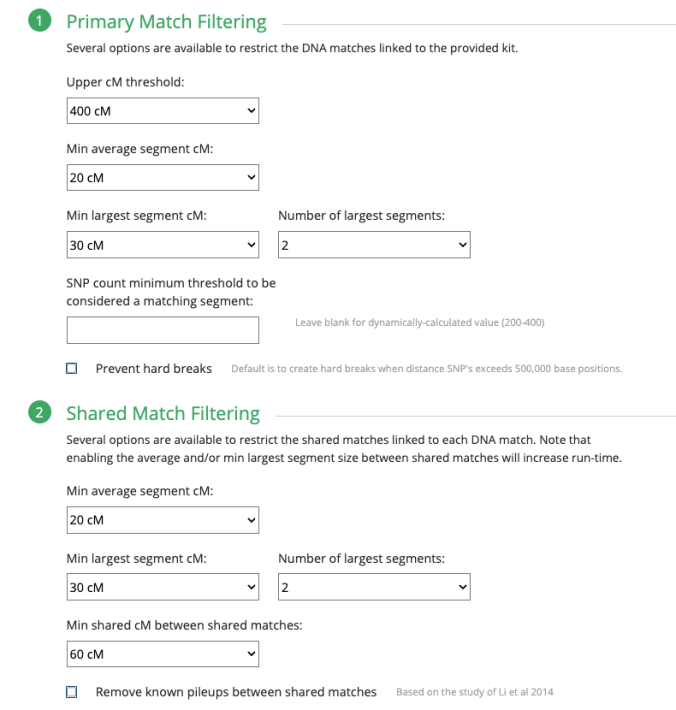
First, understanding the high settings put in place when you select “Highly Endogamous.”

So the minimum largest segment is 30cM, which is what I’ve been promoting for nearly 11 years.  This was based on my own observation when I tested a second 1C1R and could compare that 1C1R with another 1C1R who had tested a few months prior, and are 2C to each other.  Given that we have a lot of predicted 2nd to 3rd cousin matches (100cM – 300cM) where the largest segment size rarely would exceed 20cM.  With these two 1C1R who are 2C to each other, I noticed that their largest segment was 41cM.

It wouldn’t be till about 2 or 3 years later when I heard others somewhat following that same analogy and seeing the significance of a largest segment size indicating a closer ancestral connection versus an endogamous one.  This was specific with Ashkenazi Jewish background and how they seem to be set on 20cM.  By this time, I had already determined that 30cM would be best.  Also, with other Polynesians who share a true 2nd to 3rd cousin relationship, their largest segment would be larger than 20cM.  And among all the endogamous matches, it rarely would exceed 20cM.

So that was the reason why I determined that 30cM was a good amount to be used in the Min largest segment cM.  And while this blog entry is specific for this new AutoClustering tool for endogamy at GEDmatch, I have noticed that at MyHeritage, even with the endogamous matches that the largest segment size could exceed 30cM. However, what would also be indicative of an endogamous match vs. a truly close 2nd to 3rd cousin match, is the number of segments.

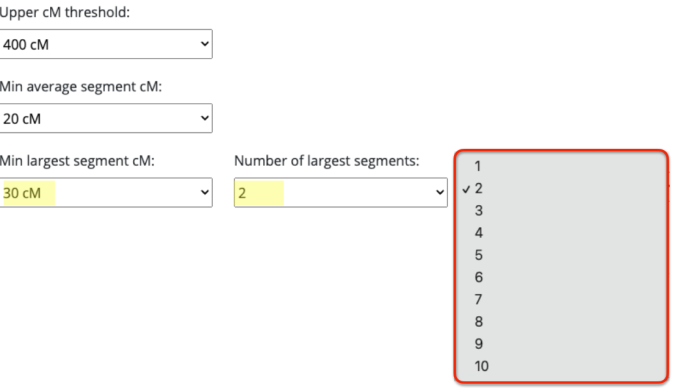
Taking a closer look and right next to the minimum largest segment size is the number of largest segments.  Thought this was interesting and not sure if it’s necessary or not.


I am assuming that when it asks for minimum largest segment followed by the number of largest segments, that would mean it will have your smallest — largest segment size set at whatever number you have selected, times whatever you selected under number of largest segments.  In other words, if you select 100cM min largest segment size, it will require that the smallest size you have is not smaller than 100cM.  And the number of largest segments, say I select 10, it would require that you have at least 10 segments no smaller than 100cM.

You rarely would get a largest segment of the same size, or at least not that I have seen in both endogamous and non-endogamous matches.  After all, these direct to consumer DNA testing companies are showing you the size of the largest segment that you have among all of the matching segments that you share.  This is probably why I initially was not generating any matches/clusters simply because I had it set to 2.  So my suggestion is to change it to 1.

So all of those parameters are allowed under the Primary Match Filtering section.  Then you have the Shared Match Filtering section which is nearly identical to the Primary Match Filtering section except you also have a minimum shared cM between shared matches which is what you also see when you run an autocluster with MyHeritage or Genetic Affairs directly.

With this parameter, you can tell it how much your DNA matches must share with each other to be considered to be put into a cluster.   And what I did was set it to as low as 100cM since I have hundreds of matches from 100cM up to 200cM.  My advice is that if you’re not admixed, or rather you have less foreign branches, definitely increase that higher than 100cM.  It was easier for me to guess the numbers to use since I know how many matches I have, and out of these varying ranges of shared DNA, how many matches I would have for each.

For example, I have hundreds of matches predicted to be 2nd cousins (Ancestry).  That is I have hundreds of matches sharing as low as 200cM and as high as 649cM.  In the predicted 3rd cousin range I have over a thousand of these type of matches which range from 90cM to 199cM.  And predicted 4th cousins, more than 24,000.  These range as low as 20cM and as high as 89cM.

In my previous post I showed an example of what my autocluster looked like from MyHeritage and that I sorted it (by total shared cM) from the lowest to the highest.  The lowest was 108cM, and from there it slowly went up.  I had 12 matches sharing 108cM.   I also had 12 matches sharing 109cM.  The number of matches sharing about the same amount can be a lot.  So understanding this will help you decide the best numbers or amounts to use when creating your clusters.

I am hoping that others from various endogamous groups start utilizing this new tool and am really curious how it will affect their research, expecting it to be for the better!  Since I am still trying to generate various clusters by constantly adding in varying numbers, I will not be posting any examples of what they look like.  Perhaps in a future blog post I will.

I also noticed that with a list of files when generating these autoclusters at GEDmatch, you also get csv files to be used in Gephi.  I posted samples of that in my post from December 2022 called In-common-with, shared matches, and clustering.  I will have to take time to also try to use these actual clusters and look to see how Gephi renders it.

AutoCluster Endogamy tool at GEDmatch.com (Part 1)

Evert-Jan Blom of Genetic Affairs developed a new AutoCluster Endogamy tool on GEDmatch together with Jarrett Ross of GeneaVlogger. Introducing it as AutoCluster Endo (AutoCluster Endogamy when you see it on GEDmatch) is a modified version of the AutoCluster clustering tool designed specifically for those dealing with endogamous matches. It was created to address analyzing endogamous matches more efficiently by filtering for the most relevant (shared) matches.

Thanks to Jarrett Ross for bringing up specific features he mentions in his video.  It allows you to filter your primary matches by adjusting the average segment size, minimum largest segments, and number of largest segments.  It also allows you to filter by your shared matches using the same filters as for primary matches and in addition, the total amount of shared cM between shared matches.

When I used to run the AutoCluster tool at MyHeritage, I noticed people would post their examples mentioning how endogamous their matches were or how burdensome, and problematic it was to deal with it.  I also noticed a marked difference between their clusters and my own.  For one, they had more than one cluster.  I initially only had a single cluster until I uploaded one of my 1C1R with whom I do not share as much DNA (as expected I guess for someone of that relationship) and was enough for this tool to pick up.  This cousin of mine appeared in my second cluster with other relatives on my paternal (non-Polynesian) side and he also produced gray squares matching several matches in the first/large cluster.

I emphasized in my AutoCluster for others to take note that the minimum threshold implemented was not 20cM or 30cM like many others that I remember seeing.  Mine was significantly higher.

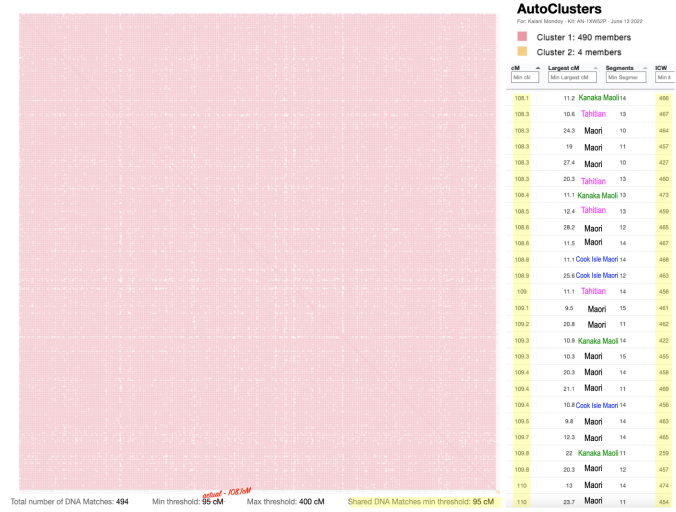
I also sorted my match list showing the lowest amount at the top, sharing 108.1cM, so the 26 matches I decided to show only shows from 108cM to 110cM.  Of course there are 470 other matches that comprise that large cluster.

I kept pointing this out to others, how our minimum threshold will vary across different populations, depending on the amount of shared DNA we have our matches and the number of matches, etc.  There is a bit more freedom with utilizing Genetic Affairs directly.

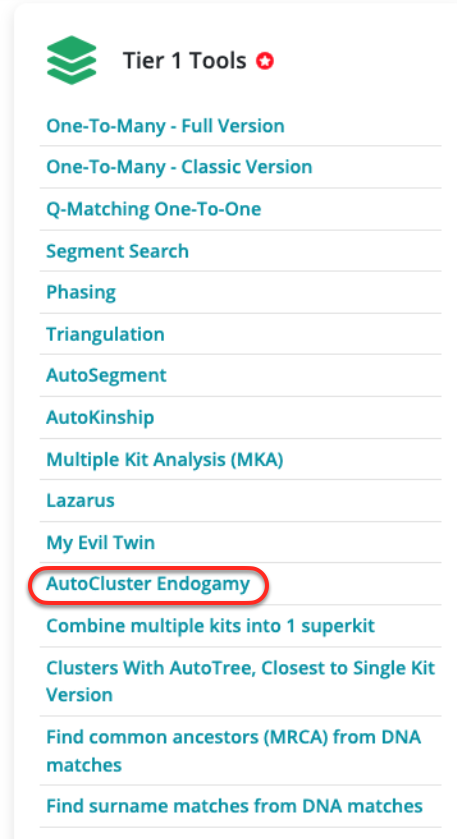
With this AutoCluster Endogamy tool at GEDmatch, you can do quite a bit.  This tool is offered to Tier 1 subscribers (Tier 1 pay-as-you-go membership $15 per month and Recurring monthly Tier 1 memberships $10 per month) only.

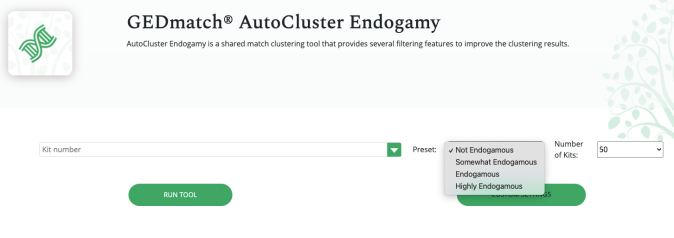
The first thing you will notice is that you have the option to select the level of your endogamy or how endogamous you are.

The default is set to “Not Endogamous.”  While I only tried the “Endogamous” option to see the difference from the “Highly Endogamous” (Polynesians should be using “Highly Endogamous”) and noticed that the parameters were set higher to numbers that are very familiar to me.

Leah Larkin (The DNA Geek) has shown in her presentations charts of various endogamous populations and to what degree of endogamy each has to deal with.  This is where I first saw how she utilized the average size segment to quantify endogamy, how to gauge how much endogamy you are really dealing with.

She took the amount of shared DNA for Close Relatives (Ancestry), predicted First Cousins, Second Cousins, Third Cousins, Fourth Cousins and Distant Cousins, divided by the number of segments to come up with the average size segment.  What was presented were various sizes present in specific endogamous populations.  She had mild, moderate and strong endogamy.  These were average size segments present in specific (predicted) relationships, i.e. 1C, 2C, 3C, etc.

In her comparison, the one that had the smallest average size segment were Polynesians. She also separated to demonstrate what Western Polynesians had compared to Eastern Polynesians.  She has confirmed (although many of us probably noticed this already) how endogamous, or extremely (“Highly” is the term used for this AutoCluster Endogamous tool at GEDmatch) endogamous Polynesians are.  This could not be done without the help of others submitting their samples to Leah for analysis.  I was able to submit one Samoan and two Kanaka Maoli samples to her to utilize. And the results were worth it!

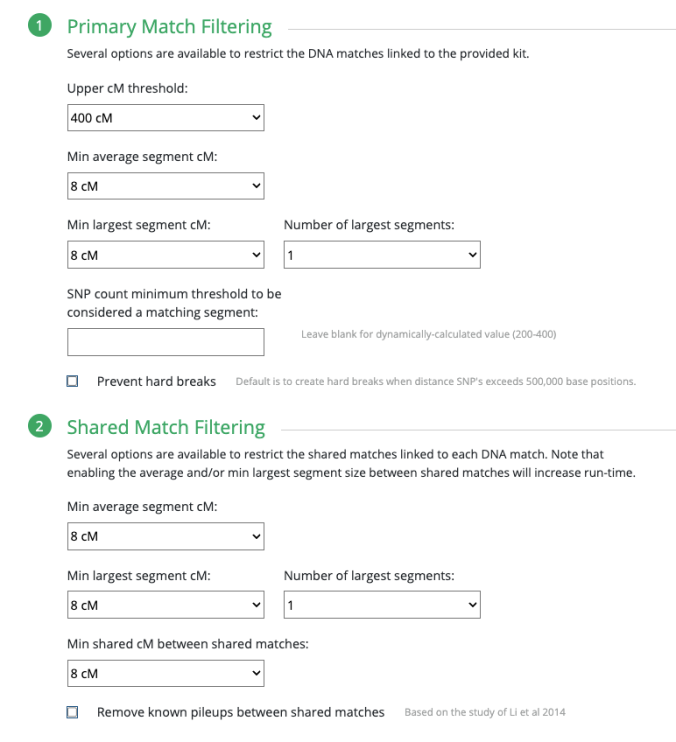
Having said all of that, do know that Polynesians should automatically select “Highly Endogamous.”  This seems to raise the Min average segment cM and other parameters.  This image below is an example of what it looks like when you do not select anything and keep it at the default “Not Endogamous.”

Even with “Not Endogamous” you can still adjust the settings to your liking.

So below are the settings that you would automatically see when selecting “Highly Endogamous.”

It is important to note, based on what I have seen others post with their own comparison and my 11 years of noticing the largest segment size among Polynesians and known relationships, that the Min largest segment cM selected for 30cM is a good minimum amount to use.  This is what you would expect around the 2nd Cousin level.

I have at Ancestry and MyHeritage (as do other relatives of mine) endogamous matches whose largest segment exceeds 30cM yet what helped distinguish it from a true close relative versus an endogamous one is how they still have a significantly high amount of segments.

Below is a table of all of my matches (Ancestry) and I have highlighted my known relatives.  The ones not highlighted are the endogamous matches.

You can clearly see how with my known (highlighted) 2C, 2C1R, and 3C1R relatives (Predited as Second Cousin) the number of segments aren’t always as high. The ones that are, they have little to no non-Polynesian lines, which means more Hawaiian branches that are coming up as matches to me.  But, the largest segment is coming from our most recent common ancestor.  Notice that for the New Zealand Maori and Kanaka Maoli matches the number of segments are really high.

For comparison, this (table below) is a cousin of mine.  Although I did not indicate the true close relatives, it should be obvious based on the high amount of segments plus the average segment size which ones are truly close relatives.

For the past 11 years, this is what I have been noticing. That it was not common to see DNA matches among Polynesians (mainly Kanaka Maoli and NZ Maori) whose largest segment size exceeded 20cM.  Utilizing the average size (taking the total shared cM divided by the number of segments), we see 7cM and 8cM to be the norm both in my cousin’s predicted First Cousin matches and my predicted Second Cousin matches.  It is pretty common even when looking at the 3rd Cousin, 4th Cousin, and Distant cousin matches.

So this is why we have the type of results you would see with autoclustering and why the need to be able to adjust these parameters in order to find the best matches (true close relatives) to be used in clustering.

So now we have an understanding of what to expect among Polynesian DNA matches as far as the average size segment, the number of segments (to help get the average size segment), and the largest segment size.  In my next blog entry, I will address the results of running this tool and how adjusting these may or may not be as useful.

One thing to note is that various companies will use the longest block (FTDNA), longest segment (Ancestry), and largest segment (MyHeritage & GEDmatch) for the same thing.  I may use these terms interchangeably, but for this particular GEDmatch tool, I’ll only refer to it as largest segment.


In-common-with, shared matches, and clusterings

There are a few tools out there that either these DNA testing companies will provide to help distinguish our matches from each other.  They are known as in-common-with (icw) or shared matches.  The idea is that a group of DNA matches on your match list who match each other indicates a common ancestor.  

Figuring out a paternal DNA match from a maternal match may or may not be as challenging for some, depending on how well of a tree you have.  It might be difficult to know if a DNA match is on your paternal grandfather vs. paternal grandmother’s side, or from a maternal grandfather vs. a maternal grandmother’s side.  Or even going back further, figuring out that a DNA match is on your maternal grandmother’s father’s or mother’s side, or that grandparent’s maternal grandfather vs. their maternal grandmother’s side.  That would also depend on how well your tree is built out, and the same would apply for your DNA matches.

This is where the shared matches or in-common-with features could help.  For Polynesians, because we match each other to some extent due to endogamy (just as other endogamous populations will experience this), it can be confusing, misleading and really not useful.

Clustering

Visually, there are a few tools to help make it easier for you to distinguish.  Clustering (auto-clustering) is another tool, something that MyHeritage offers or you could use a third-party site such as GeneticAffairs.com to visually show you groups of matches.

Here I show a few of my 1st cousins who have DNA tested, both on my father’s and mother’s side.

My paternal 1st cousins are represented in the green.  My maternal 1st cousins are in red.  Then there are my 2nd cousins on my maternal grandfather’s side represented by the orange.  Going further back on my grandfather’s side, specifically to his mother’s side I have two 2nd cousins once removed who have tested, they’re in blue.  Then on my grandfather’s paternal side, other distant cousins, they are in lavender.

A closer look at this shows how on my father’s side (green) my 1st cousins will match each other, defined by a line.  Since we are all 1st cousins to each other, cousin 1 will match cousins 2, 3, 4, 5, 6 & 7, plus me of course as these are my DNA matches.  Cousin 2 will match 1 (as already mentioned) plus 3, 4, 5, 6 & 7.  The same for 3, 4, and so forth.  

For my mother’s side, I started off with the color red, my grandparents’ grandchildren. We all match each other.  Then going to my 2nd cousins (orange), they come from two different sisters of my grandfather Joseph.  So they all match each other, plus match me and my 1st cousins.  Then going back further on Joseph’s mother’s side (blue), they match each other plus my 2nd cousins plus my 1st cousins as we are descended from my grandfather’s mother Elena’s ancestors. Then finally my grandfather Joseph’s father’s side (lavender).  So while those cousins will match my 2nd cousins and my 1st cousins, they will not match my grandfather Joseph’s mother’s side.  That is the basic concept of how this will visually work.

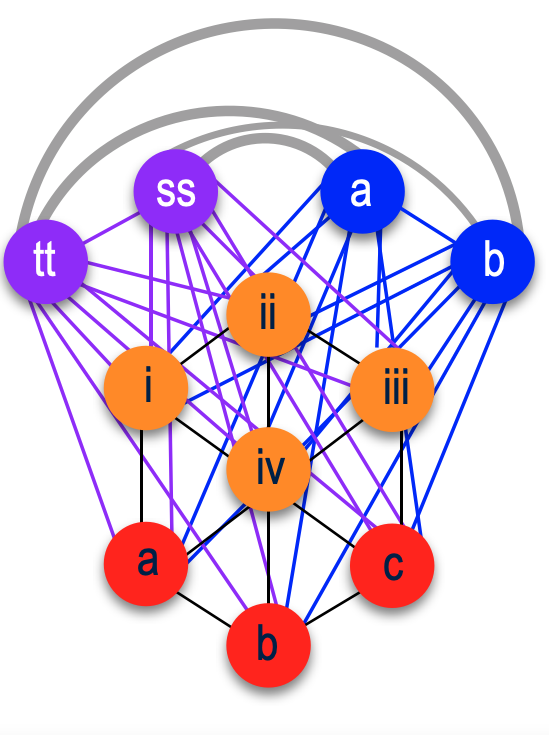
With endogamy, or with Polynesian matches, that same cluster would basically have all the dots connecting each other.  So imagine my grandfather’s father’s side (lavender) matching my grandfather’s mother’s side (blue).   See the grey lines connecting the two sides.


Example of every dot connecting to each other – what you would expect to see with endogamous matches.

In reality, that is what we will see because of how we all match each other.

Gephi

I finally took the time to try to use a network analysis software called Gephi to demonstrate what this interconnected group of DNA matches could look like.  Previously I used a website’s tools.  That website is RootsFinder.com, and used their Triangulation tool that produced nearly identical results as Gephi.  But for now, just demonstrating what Gephi has to offer.

This diagram consists of 196 nodes (dots) and 9,494 edges (lines).  To get that, I had to import a csv (spreadsheet) file, the icw file which has 9,494 lines of names into Gephi.

As I said earlier, while these clustering tools do not work due to the fact that we connect to each other and usually at a very high amount of shared DNA, I was able to extract some information from it.  I probably could have extracted and gathered all of this data manually but taking it directly from a spreadsheet is not as easy as it is just data that are organized by columns, rows, and/or categories.  This is why these tools are available in order to provide a more visual way of interpreting your matches.

What I did gather from this and thought was interesting was that the longest segment size showed 12cM for 24% of my matches.  I noticed this years ago that the size of the longest segment, largest segment, or longest block (depending on the DNA testing company) for many of these predicted 2nd – 3rd cousins would be between 12cM – 14cM.  Rarely would it go over 20cM.  In my previous blog entries, I mentioned the importance of the longest segment size in determining a true 2nd – 3rd cousin.

Looking at that same data, we see that only a single DNA match has the longest segment size of 64cM.  That DNA match is actually my 2C2R (2nd cousin twice removed). 

This next image is the same data except now it’s showing the number of shared segments.  Prior to  Ancestry providing us the longest segment size, we only had to go by the amount of total shared DNA and the number of segments.  So the top (28% of my matches) shows 28 segments.  They seem to range between 25 – 29 for the most part.

An important thing to notice about this particular data, unlike other people who could actually produce nice clusters, is that when I ran this icw file that took about 4hrs to do, I had to limit the amount of shared cM (centimorgans).  This particular diagram in which the icw file I finished running last night range from 185cM – 199cM.  Yet I had 98 matches that fell into that range.

Prior to this particular icw file, I ran one back in May 2022 where I went as low as 90cM.  So it is 90cM – 190cM.  This was the result of that older icw file.

Looking at the data, 13 segments seems to be at the top making up about 14% of these matches.  That particular file had 1,215 matches, which the icw file produced 2,049 nodes and 1,046,502 edges.  That is a lot of dots and lines.

A few people had suggested using Gephi as I could tweak the data. I have been tweaking it for about a week, and as I knew I would not be able to get anything unique from it.  

The problem with this, something that any endogamous group would encounter is running the icw file.  Imagine having only 10 DNA matches.  But for an endogamous person where you could match nearly all the other people even if you are not really closely related at all, that could be easily multiplied.  So match #1 would match all of the other 9 matches on that list.  Match #2 would have about the same matching all 9 other matches on that list.  And the same for match #3, match #4, etc.  So that icw file gets larger and larger.  Now complicate that issue as the less amount of DNA you share, you probably match more people or have a longer list of icw people to add.  This is why I initially ran it again since last May but going down only as low as 185cM from 199cM rather than 90cM – 190cM.  As I go lower, the number of matches, the number of nodes and edges will greatly increase.

For non-endogamous populations, expect to see something that would be more clear.  Utilizing Gephi you could easily attach names and whatever data you would like to the nodes and distinguish each cluster from each other easily.

Auto-Cluster

As I mentioned MyHeritage as one of the DNA testing sites that offers auto-clustering with your DNA  matches.  If you have tested at MyHeritage, you could run an auto-cluster as often as you would like.  Unlike GeneticAffairs.com where you could adjust the parameters, MyHeritage seems to do it automatically.  So depending on the number of matches that you have, or in my case could have a lot of icw, they (automatically) decide what would be best to produce a decent amount of matches.

First, an example of what you would see with autoclusters:

What are autoclusters

Image from MyHeritage’s FAQ page.

What you would get are colored blocks assigned randomly.  The grey square are DNA matches who happen to match someone in one cluster as well as in another cluster.  This could indicate that you have a DNA match who might not have enough shared DNA to match everyone in a particular cluster, something that you would see in a more distant relative like a 2nd cousin of yours not matching a lot of your common 3rd cousins. 

That is basically how clusters work.  They are to help you figure out how your DNA matches match each other.  Then of course it is up to you to figure out based on their trees how all of you connect.

This autocluster of mine I generated back in June.

I actually now have two clusters.  MyHeritage puts a limit as how the maximum amount of shared DNA to be used in autoclusters.  400cM, since that is about the level what you would share with 2nd cousins, not with 1st cousins, maybe a few 1C1R (1st cousins once removed).  My second cluster which reflects my paternal (Filipino) side actually does consist of two 1C1R, a 1/2 1C and a 2C (2nd cousin).  One of those 1C1R in my second cluster is also Kanaka Maoli like myself, so that cousin did produce a few grey squares with some of my other DNA matches in that larger cluster.

What I also did was extract the data which I put on the right-hand side.  I sorted it by the least amount of shared DNA and identified the person if I knew their ancestry. You can also see the size of the largest segment and the number of segments.

A reminder that with MyHeritage’s autoclusters they implement a maximum threshold of 400cM.  The minimum threshold will vary depending on the person’s DNA matches, how much they share with you as well as how much they share with each other.

In my case, there were 494 matches taken from my list who share less than 400cM with me but more than 95cM (actually 108.1cM was the lowest amount shared).   They also decided that in order to be considered a shared DNA match, my matches need to match at least 95cM with each other.

Conclusion

While these tools are great for separating your DNA matches and possibly help you figure out how each one is connected to you and to each other, Polynesians will not benefit from these at all.  They actually could be misleading if they one does not understand what they are looking at, which is a lot of closely predicted 2nd, 3rd and 4th cousin matches.