There are a few tools out there that either these DNA testing companies will provide to help distinguish our matches from each other. They are known as in-common-with (icw) or shared matches. The idea is that a group of DNA matches on your match list who match each other indicates a common ancestor.
Figuring out a paternal DNA match from a maternal match may or may not be as challenging for some, depending on how well of a tree you have. It might be difficult to know if a DNA match is on your paternal grandfather vs. paternal grandmother’s side, or from a maternal grandfather vs. a maternal grandmother’s side. Or even going back further, figuring out that a DNA match is on your maternal grandmother’s father’s or mother’s side, or that grandparent’s maternal grandfather vs. their maternal grandmother’s side. That would also depend on how well your tree is built out, and the same would apply for your DNA matches.
This is where the shared matches or in-common-with features could help. For Polynesians, because we match each other to some extent due to endogamy (just as other endogamous populations will experience this), it can be confusing, misleading and really not useful.
Clustering
Visually, there are a few tools to help make it easier for you to distinguish. Clustering (auto-clustering) is another tool, something that MyHeritage offers or you could use a third-party site such as GeneticAffairs.com to visually show you groups of matches.
Here I show a few of my 1st cousins who have DNA tested, both on my father’s and mother’s side.

My paternal 1st cousins are represented in the green. My maternal 1st cousins are in red. Then there are my 2nd cousins on my maternal grandfather’s side represented by the orange. Going further back on my grandfather’s side, specifically to his mother’s side I have two 2nd cousins once removed who have tested, they’re in blue. Then on my grandfather’s paternal side, other distant cousins, they are in lavender.

A closer look at this shows how on my father’s side (green) my 1st cousins will match each other, defined by a line. Since we are all 1st cousins to each other, cousin 1 will match cousins 2, 3, 4, 5, 6 & 7, plus me of course as these are my DNA matches. Cousin 2 will match 1 (as already mentioned) plus 3, 4, 5, 6 & 7. The same for 3, 4, and so forth.
For my mother’s side, I started off with the color red, my grandparents’ grandchildren. We all match each other. Then going to my 2nd cousins (orange), they come from two different sisters of my grandfather Joseph. So they all match each other, plus match me and my 1st cousins. Then going back further on Joseph’s mother’s side (blue), they match each other plus my 2nd cousins plus my 1st cousins as we are descended from my grandfather’s mother Elena’s ancestors. Then finally my grandfather Joseph’s father’s side (lavender). So while those cousins will match my 2nd cousins and my 1st cousins, they will not match my grandfather Joseph’s mother’s side. That is the basic concept of how this will visually work.
With endogamy, or with Polynesian matches, that same cluster would basically have all the dots connecting each other. So imagine my grandfather’s father’s side (lavender) matching my grandfather’s mother’s side (blue). See the grey lines connecting the two sides.
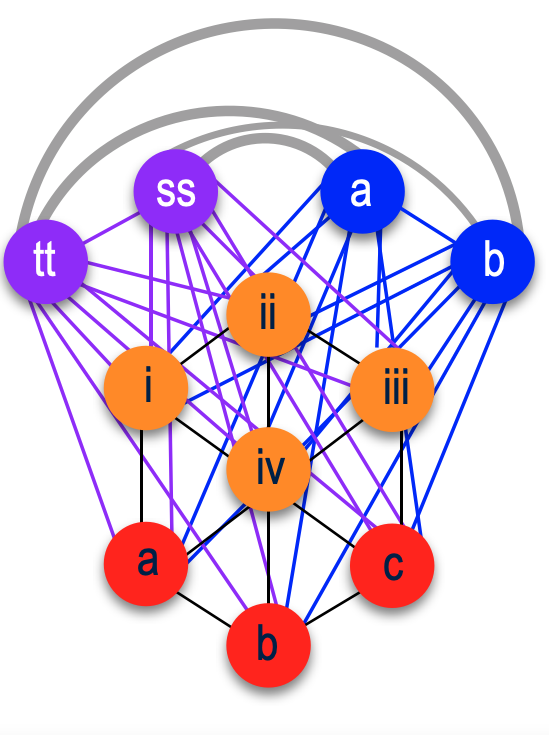
Example of every dot connecting to each other – what you would expect to see with endogamous matches.
In reality, that is what we will see because of how we all match each other.
Gephi
I finally took the time to try to use a network analysis software called Gephi to demonstrate what this interconnected group of DNA matches could look like. Previously I used a website’s tools. That website is RootsFinder.com, and used their Triangulation tool that produced nearly identical results as Gephi. But for now, just demonstrating what Gephi has to offer.

This diagram consists of 196 nodes (dots) and 9,494 edges (lines). To get that, I had to import a csv (spreadsheet) file, the icw file which has 9,494 lines of names into Gephi.
As I said earlier, while these clustering tools do not work due to the fact that we connect to each other and usually at a very high amount of shared DNA, I was able to extract some information from it. I probably could have extracted and gathered all of this data manually but taking it directly from a spreadsheet is not as easy as it is just data that are organized by columns, rows, and/or categories. This is why these tools are available in order to provide a more visual way of interpreting your matches.
What I did gather from this and thought was interesting was that the longest segment size showed 12cM for 24% of my matches. I noticed this years ago that the size of the longest segment, largest segment, or longest block (depending on the DNA testing company) for many of these predicted 2nd – 3rd cousins would be between 12cM – 14cM. Rarely would it go over 20cM. In my previous blog entries, I mentioned the importance of the longest segment size in determining a true 2nd – 3rd cousin.
Looking at that same data, we see that only a single DNA match has the longest segment size of 64cM. That DNA match is actually my 2C2R (2nd cousin twice removed).
This next image is the same data except now it’s showing the number of shared segments. Prior to Ancestry providing us the longest segment size, we only had to go by the amount of total shared DNA and the number of segments. So the top (28% of my matches) shows 28 segments. They seem to range between 25 – 29 for the most part.

An important thing to notice about this particular data, unlike other people who could actually produce nice clusters, is that when I ran this icw file that took about 4hrs to do, I had to limit the amount of shared cM (centimorgans). This particular diagram in which the icw file I finished running last night range from 185cM – 199cM. Yet I had 98 matches that fell into that range.
Prior to this particular icw file, I ran one back in May 2022 where I went as low as 90cM. So it is 90cM – 190cM. This was the result of that older icw file.

Looking at the data, 13 segments seems to be at the top making up about 14% of these matches. That particular file had 1,215 matches, which the icw file produced 2,049 nodes and 1,046,502 edges. That is a lot of dots and lines.
A few people had suggested using Gephi as I could tweak the data. I have been tweaking it for about a week, and as I knew I would not be able to get anything unique from it.
The problem with this, something that any endogamous group would encounter is running the icw file. Imagine having only 10 DNA matches. But for an endogamous person where you could match nearly all the other people even if you are not really closely related at all, that could be easily multiplied. So match #1 would match all of the other 9 matches on that list. Match #2 would have about the same matching all 9 other matches on that list. And the same for match #3, match #4, etc. So that icw file gets larger and larger. Now complicate that issue as the less amount of DNA you share, you probably match more people or have a longer list of icw people to add. This is why I initially ran it again since last May but going down only as low as 185cM from 199cM rather than 90cM – 190cM. As I go lower, the number of matches, the number of nodes and edges will greatly increase.
For non-endogamous populations, expect to see something that would be more clear. Utilizing Gephi you could easily attach names and whatever data you would like to the nodes and distinguish each cluster from each other easily.

Auto-Cluster
As I mentioned MyHeritage as one of the DNA testing sites that offers auto-clustering with your DNA matches. If you have tested at MyHeritage, you could run an auto-cluster as often as you would like. Unlike GeneticAffairs.com where you could adjust the parameters, MyHeritage seems to do it automatically. So depending on the number of matches that you have, or in my case could have a lot of icw, they (automatically) decide what would be best to produce a decent amount of matches.
First, an example of what you would see with autoclusters:

Image from MyHeritage’s FAQ page.
What you would get are colored blocks assigned randomly. The grey square are DNA matches who happen to match someone in one cluster as well as in another cluster. This could indicate that you have a DNA match who might not have enough shared DNA to match everyone in a particular cluster, something that you would see in a more distant relative like a 2nd cousin of yours not matching a lot of your common 3rd cousins.
That is basically how clusters work. They are to help you figure out how your DNA matches match each other. Then of course it is up to you to figure out based on their trees how all of you connect.
This autocluster of mine I generated back in June.

I actually now have two clusters. MyHeritage puts a limit as how the maximum amount of shared DNA to be used in autoclusters. 400cM, since that is about the level what you would share with 2nd cousins, not with 1st cousins, maybe a few 1C1R (1st cousins once removed). My second cluster which reflects my paternal (Filipino) side actually does consist of two 1C1R, a 1/2 1C and a 2C (2nd cousin). One of those 1C1R in my second cluster is also Kanaka Maoli like myself, so that cousin did produce a few grey squares with some of my other DNA matches in that larger cluster.
What I also did was extract the data which I put on the right-hand side. I sorted it by the least amount of shared DNA and identified the person if I knew their ancestry. You can also see the size of the largest segment and the number of segments.
A reminder that with MyHeritage’s autoclusters they implement a maximum threshold of 400cM. The minimum threshold will vary depending on the person’s DNA matches, how much they share with you as well as how much they share with each other.
In my case, there were 494 matches taken from my list who share less than 400cM with me but more than 95cM (actually 108.1cM was the lowest amount shared). They also decided that in order to be considered a shared DNA match, my matches need to match at least 95cM with each other.
Conclusion
While these tools are great for separating your DNA matches and possibly help you figure out how each one is connected to you and to each other, Polynesians will not benefit from these at all. They actually could be misleading if they one does not understand what they are looking at, which is a lot of closely predicted 2nd, 3rd and 4th cousin matches.

This is helpful! Thank you for sharing.
LikeLiked by 1 person
Hi Kalani
As I mentioned much earlier I trace my heritage back to Teio (Tahiti), Toofaiti (Huahine) and Tevarua (Tahiti) of the Bounty (among others as well of course) I did see the comparative study had been done of some Norfolk Islanders who identified back to certain Mutineer family names and wonder if you know of anyone I could request to compare my DNA with those and others who identify as descendants of the Tahitian Women of the Bounty.
If this is possible (even on a fee basis) please advise exactly the format I should follow to forward my DNA Results (FTDNA, Myheritage, Ancestry, )
For me it would be wonderful to actually connect to even one of the families still living in French Polynesia from whom the Bounty women were taken and I realise that teh French authorities are not at al keen on their citizens taking DNA tests so this exercise is all the harder
Many thanks and I look forward to your advice realising that you must be inundated with such requests as mine and have little time for your own investigations
Jacqui Chapman- Shone
LikeLike
Hi Jacqui,
Which company did you test with? I know some descendants tested at Ancestry. I’ve seen them randomly when I was looking at my distant matches.
LikeLike
My DNA was tested with 3 companies
FTDNA – Kit 482397 matches me with MW Pitcairn
Myheritage Kit 565231951 – Links to NL, G&HM, RP, WT, all in Tahiti & others
Ancestry – tupunavahine@gmail.com says 7% Eastern Polynesian& Maori NZ 1000 matches at 4th + cousin level
LikeLike
Pingback: AutoCluster Endogamy tool at GEDmatch.com (Part 2) | Polynesian DNA