Identifying & Excluding Endogamous Matches

How can you tell if your match is a true 2nd – 3rd cousin match versus an endogamous match?  Here are a few steps to identify a true close match or exclude endogamous matches.  While I am keeping Ancestry matches in mind, this applies to other DNA testing companies as well.

  1. Name
  2. Tree: location
  3. Ethnicity [Ancestry only]
  4. Longest Segment (largest segment; longest block)
  5. Number of segments

1 – Name: When looking at a DNA match’s name, it’s not always clear.  A DNA match could carry an adopted name or even a married name.  So since I am Kanaka Maoli,  I would usually ignore a Maori-looking name, or a Samoan name, Tongan name, etc.  But there is that possibility that a Kanaka Maoli wahine (female) could have married a Maori, Samoan, etc. and carries her husband’s surname, or that a Kanaka Maoli was adopted by one of those groups mentioned. But doing this, helps me focus on Kanaka Maoli matches, therefore excluding a lot of the endogamous matches.

2 – Tree: location:  If the match has a tree, look at their tree.  If I see that they have ties to New Zealand, I would exclude them since they are endogamous matches.  Basically I would concentrate on the location of the people listed in these trees to my known ancestral areas.  For me, that would be only 3 islands.  Molokai, Hawaiʻi island and Oʻahu.

3 – Ethnicity:  This applies to Ancestry only since they have the following specific categories.  Hawaii, New Zealand Maori, Samoa, Tonga.

Kanaka Maoli will normally get some smaller percentage of New Zealand vs. the higher percentage of Hawaii.  The same applies for Samoans and Tongans where they would get a smaller percentage of the other’s population/ethnicity showing up.  So if I see that the match has 70% New Zealand Maori and 30% Hawaii, I would ignore it unless the percentages for each were switched.  The higher percentage of Hawaii would indicate a Kanaka Maoli.   One thing to note is that if the person is of mixed Polynesian ancestry, these percentages will vary.  Cook Island Maori and sometimes French Polynesians will get almost a 50% – 50% of each (Hawaii & New Zealand Maori).  We see the same with other Western Polynesian who could have almost an equal percentage of Samoa and Tonga.

4 – Longest segment:  This has always been the most obvious from a decade ago when looking at your matches beyond a 1st cousin.  The longest segment size was pretty large compared to an endogamous match where the longest segment would rarely exceed 20cM.  MyHeritage does have largest segment size as large as 30cM due to uploads from other DNA testing companies and imputation.  But step 5 would help with that.  FTDNA calls it longest block.

5 – Number of segments:  All DNA testing companies show the number of segments.  At FTDNA, you need to count them yourself.  But taking the number of segments and dividing that by the Total Shared will give you the number of the average-sized segment.  The number you will probably see will not exceed 11cM.  In my most recent blog entry, I posted a chart comparing my known relatives among endogamous matches and you can see what the average-sized segment is.

The highlighted ones are my known relatives.  But you can see with a couple of them, the averaged-sized segment might be small – 8cM or 9cM.  Taking a closer look at those two known relatives (3C1R for both), their longest segment is at least 30cM for one, the other 41cM.

Follow all these steps and you will be certain to find your best match and exclude endogamous matches.

Ancestry’s 2023 Ethnicity Updates

This year’s ethnicity updates introduced a few new regions, but nothing new for the Polynesian categories.  This has made people’s results seem to fluctuate just a little where they find a small increase or decrease in percentage with various existing categories.  For some, there might be new categories (if they received a new region) and for others, the new category that they received is usually something very small, usually less than 5%.

For the ever-evolving categories relating to Polynesians, we have seen how the number of samples has significantly increased over the years, compared to other populations.

Looking through Ancestry’s white paper from 2013 and how since 2018 they have been updating yearly, I extracted the following numbers of reference samples for specific categories created for Polynesians.

The Polynesia category was first created in late 2013  and that category consisted of just 18 samples.  Apparently, they had the same amount for Melanesia (previously reported as 28 samples).1

In 2018, Ancestry made its first ethnicity update since implementing the Polynesia category. They increased their 18 samples to 58, and in 2019 made a significant increase up to 188 samples.  In that same year they also introduced a Samoa and Tonga category which would now allow the small 1% – 4% to show up for some Polynesians, mainly Hawaiians and New Zealand Maoris.   But Samoans were finding a large percentage of Tonga showing up in their DNA results, just as Tongans noticed the same with the Samoa category in their DNA results, and to a lesser extent they both might have 1% – 2% Polynesia.  This is expected given how we see overlap with other populations that are similar to each other.

In 2020 they renamed the Polynesia category to Eastern Polynesian & New Zealand Maori while continuing to increase the number of samples for all three categories.  An interesting choice for a category name that seemed to specify one Polynesian population and all others relegated to a region – east.

Two years later they decided to split that category into two.  Hawaii, and New Zealand Maori.  This would leave both populations having some percentage of the other population in their results, just as with Samoans and Tongans and other non-Polynesian populations.

While it’s not accurate, it does allow us to quickly see what ethnicity or population the DNA match is from. At least with Hawaiians and New Zealand Maoris, there is about a 70% – 30% ratio, the dominant being the population that the person really is from.

Perhaps with the ever-increasing amount of Polynesians getting DNA tested and if they have good trees, we could have even more specific island populations appearing. We have seen how they tried that with the DNA communities although they have not recently updated those communities.  Given that the communities are based on DNA matches and how they connect/network with other matches, and how we already know that we could easily match other island populations despite having no recent genealogical ties to each other, I do not expect to see any changes with those.

Ancestry’s DNA Matches Split by Parent

A few months ago Ancestry attempted to split people’s matches by parent.  This helps people to figure out how their matches are related to them by splitting up your matches based on your DNA,  and not family trees. They utilize their SideView™ technology, where they group your matches according to the parent they’re related to.

So they split your matches by parent 1 and parent 2, or if you already labeled them, paternal vs. maternal. But for Polynesians and other endogamous populations, we can also have a lot of matches falling under “Both sides.”

Initially, I only had 29 matches falling under “Both sides.”  My mother ended up with 2,231 matches for Both sides.

It is understandable why my mother would have a lot given that both of her parents were Kanaka Maoli.  But in my case, since my father was Filipino I should not have any under Both sides, unless they really are related to me on Both sides.  I do have a few like that, but they never got DNA tested.

After analyzing all 29 matches, I did see that all of them were the same background as I am.  Filipino, but specifically having ties to Bisaya, the region where my father’s parents were from, and also Kanaka Maoli.  So they could be some distant match on my Filipino side, but we also witness somewhat of endogamous matching going on because not all of these matches will have ties specific to my grandparents’ hometown or island, and just so happen we match DNA because of our shared DNA Kanaka Maoli segments. 

Recently, they had an update.  So now we have more matches that have been assigned including more matches for Both sides but not as much as I thought I would get.  While my mother’s and a couple of thousands up to 6,000 matches on Both sides, as they do have both parents who are Kanaka Maoli, again with my own it should not be the case.

This time while going through the additional 20 new matches categorized under Both sides, I noticed that not all of them had any Filipino and a few of them were not Polynesian at all. 

After carefully looking through these matches and their shared matches, I realize that the matches were either 100% Filipino or 100% Polynesian, or admixed Polynesian without any Filipino.  The amount of shared DNA segments that these matches have with each other is significant enough to put them into the Both sides category.

I saw 100% Filipino matches who were connecting via my paternal side would share DNA segments with matches from my maternal side due to the fact that the matches on my maternal side are also Filipino as well as Kanaka Maoli.  And the same for those on my maternal side where they do not have any Filipino ancestry but could share DNA segments with matches on my paternal side and who happen to be part Kanaka Maoli like myself.  But I’ve seen 100% New Zealand Maori falling under Both sides.  

So while I understand endogamous populations like Ashkenazi Jewish people can have thousands and thousands of matches under Both sides, just as I am seeing with other Polynesians, I did not expect this phenomenon to happen to me simply because my parents were of different populations.  First I realized it was because these matches under Both sides had the same exact background as me.  But now with this latest update, it is not the case, but has a lot to do with the fact that Hawaiʻi consists of islands who received other island populations (Japan, Philippines, Portuguese, Puerto Rico), and those people mixed into the current population at that time. 

I have not looked at other accounts that I manage, like cousins who are of Portuguese and Kanaka Maoli ancestry.  Majority of those Portuguese immigrants were from Portuguese islands.  I am sure that is happening with these populations or admixed people as well.

Curious what future updates might yield, given that I see 100% Filipino and admixed Polynesians (not limited to Kanaka Maoli) can easily fall under Both sides for me.

AncestryDNA’s Ethnicity Update, Ethnicity Inheritance, and Chromosome Painter

Ancestry updated their ethnicities again, although they made some adjustments earlier this year. They also released their Ethnicity inheritance back in May. You can read more about it here: SideView™ Technology.

They also have a Beta version of a Chromosome PainterBeta where they paint the chromosomes with the regions they’re associated with in your ethnicity estimate.

ETHNICITY INHERITANCE

Ethnicity Inheritance

The Ethnicity inheritance estimates which regions you inherited from each parent.  Once you know which side belongs to which parent, you can edit it, identify your paternal and maternal sides.


CHROMOSOME PAINTER

Currently, the Chromosome Painter is in Beta and not everyone have this feature yet.  It attempts to assign each ethnicity to a specific part of your chromosome.

You can click on paternal, maternal, or see them all together.  You can also click on each ethnicity to see where specifically they are located on each chromosome.


NEW REGIONS

The former Eastern Polynesia & New Zealand Maori region is now in two separate categories – Hawaii and New Zealand Maori regions. These new regions are supposed to provide more precise results for people of both Hawaiian or Kanaka Maoli (aboriginal Hawaiian) and Maori heritage.

They state that while people from places near or with deep historical and genetic ties to Hawaii and New Zealand like French Polynesia and the Cook Islands, will most likely see their previous Eastern Polynesia & New Zealand Maori percentage split between the new Hawaii and New Zealand Maori regions. This is similar to when they created the Samoa and Tonga categories and Samoans were getting some small percentages of the Tonga region and Tongans were getting small percentages of the Samoa regions plus anywhere from 0% to 2% of Eastern Polynesia & New Zealand Maori, just as we would get 0% – 2% Samoa or Tonga and that would vary with every update.

They have made a few “updates” which I believe was an increase in the number of their reference samples.  

Currently, their reference panel has 68,714 DNA samples that divide the world into 84 overlapping regions and groups.  For the Polynesian groups:

Hawaii – 392
New Zealand Maori – 206
Samoa – 91
Tonga – 164

I tried to see if there was some type of pattern as far as how much of the Hawaii region would show up versus the New Zealand Maori region for Hawaiians and Maoris.  There almost seem to be some consistency from what a few Hawaiians and Maoris have been showing me.  

Just comparing my own results, along with my mother’s and one of my cousins.

Focusing on the Polynesian percentages.

When looking at my cousin’s results, since she’s not admixed, I figured maybe it’s about  70% of the correct region versus the other 30% of the other region that we’re not part of.  Other people have shown me their results and it seems like they do fit that range.

When I calculate the percentages that both what my mother and I have, this is what I came up with:


It seems pretty close to that 70% vs. 30%, but not consistently as I do see varying results from other people including some of my other relatives.

At first, I thought this is more prevalent among those who are less than 25% Polynesian since those who were sharing these varied percentages had only a single grandparent or great-grandparent and beyond who was Polynesian.  A closer look at my own relatives I realized it’s still not consistent.

One of them does fall into that range I expected while the other two are similar to each other, more of an 80/20 split.  

And then there are some of my relatives I saw that still have that small percentage of Samoa or Tonga.

While it would be nice to see 100% matching to the appropriate region, that would apply to everyone else who aren’t Polynesian and have mentioned how they do not show the correct amount of German or French or Spanish vs. Portuguese, or like with  my own results where they removed my “England and Northwestern Europe” and replaced some of it with “Wales” and some of it went to my “Norway” region.

I have been keeping track of all of the updates I’ve been getting since I tested with Ancestry back in 2014.

So as they attempt to get specific with our region when back in 2018 they (the science team) told me to my face that they cannot split the former Polynesia region, it becomes less accurate and seems to cause more confusion.

And while their communities are still there (they are below the regions and other features near the bottom of your results), I continue to witness many who still believe that they do have ties to that other region, whatever is not known in their genealogy.  Like a Hawaiian insisting that they have Maori heritage or a Maori having Hawaiian heritage when the paper trail does not support it and/or they are known to just not have that heritage at all.

What confuses people more about the ethnicities is the fact that we can be a very close match to other Polynesians, particularly those of the same region.  So a New Zealand Maori and a Hawaiian for example can be predicted as first or second cousins.

Here I compare that same cousin that I mentioned who isn’t admixed, showing her top/highest/closest endogamous matches.  I identify who is NZ Maori vs. Hawaiian (Kanaka Maoli).  Then I added in my own top matches who are my known closest cousins. 

There is an easy way to distinguish a true 1st, 2nd or maybe 3rd cousin match from an endogamous match.  The longest segment for example is essential in determining a true 1st, 2nd or 3rd cousin match.  Also with endogamous matches are the high amount of segments, something that you will not see with your true 1st, 2nd or 3rd cousins.

In a future blog post, I will blog more about these anomalies that exist for Polynesian matches, and the difference between an eastern Polynesian versus western Polynesian match.

But for now, hoping that with more updates the results become more precise and cause less confusion.

Making a connection: Utilizing the Longest Segment size

On December 29, 2021 while going through my new matches at AncestryDNA, I decided to go through my closest matches to be sure I didn’t miss anyone. Usually, these closer matches are endogamous, mostly New Zealand Maoris.

While going through my list of top matches, I noticed a match that I haven’t viewed and had a Japanese surname, which to me would indicate that the match has ties to Hawai’i. And I was right, but more surprisingly, he shared a fairly large segment with me – 41cM. The person had no tree, so I immediately contacted him identifying my maternal grandparents and their parents. Right after that I began to search everything I could and managed to only find the names of his parents, as all three of these people (including the match) were star athletes, so their names came up often in the newspaper. I couldn’t find anything else other than their accomplishments and winnings.

The usual process that I do to figure out how a DNA match is connected is to compare with other relatives and to see which one of these relatives shares a large segment, at least 30cM. This would indicate a non-endogamous match, or rather it is more likely to be a true 2nd – 3rd cousin match. Since I have access to these relatives’ accounts, I can see how large of a segment they share. Using the “Shared Matches” feature is not useful when dealing with Polynesian matches as we tend to match everyone.

The cousins whose account I have access to are in bold. (These are not their real names)

So I go through my list of matches, and usually I can figure it out with the longest segment size to which branch the match belongs. But that may not be as effective once you get into the 3rd cousin range. In fact, while Jan, Steve, Lani and Lei are all my 2nd cousins, Jan and I share a longest segment size of 24cM while the others exceed 30cM. This is why I have been pushing the 30cM longest segment size, although sometimes, as the exception with me and Jan, it may not be as large. But with Jan compared to Lani and Lei (her 2nd cousins) and with her brother Steve compared to Lani and Lei, and when I compare myself to Lani and Lei, we do all share a longest segment size that is more than 30cM.

But this is what it looked like for all of us when I compared the longest segment size.

So while Steve had the next highest (after me & my mother) longest segment size, it wasn’t enough to convince me that the match was on my grandfather’s side. And while I usually ignore the total shared amount of DNA when trying to narrow down to which branch (my grandfather’s paternal vs. maternal side or my grandmother’s paternal vs. maternal side) that match belongs, you can see that compared to my 2nd cousins Lani, Lei, Jan and Steve, only Lani shares less total shared DNA with this new DNA match than I do. But my other 2nd cousins including my 1/2 1st cousin Angies shares more DNA than I do.

Days later I looked into the match again. And not with my other DNA matches as I’ve exhausted all avenues on the DNA aspect and matching, but rather searching for my match’s ancestors.

Again, since the match and his parents were athletes, I kept finding mostly articles about their sports activity, accomplishments and winnings. I also found sports photos of them in yearbooks (on Ancestry), and looked through social media, trying to compare features of the match’s parents, although you really can’t compare with Polynesians. A lot of Polynesians, even admixed Polynesians look like some aunt, uncle or cousin of mine. But then it dawned on me, what are the chances of the match actually being related to me via his mother? Her full name was mentioned in the paper, yet I was focusing on his father and actually stopped searching because I could not find more information on his father. I even looked in my (genealogy) database of all the family members that I have, looking for this match’s surname just in case I had it. But I did not. So now I thought I should really focus on the mother.

I managed to find in the 1972 Directory of City & County of Honolulu the match’s mother living at an address that was the same as what I believed were her parents. And from dates in the yearbook photos of the mother and maternal grandfather, the mother was not much younger than me. That made me realize that it is more likely that the connection is a few generations back.

I searched the newspapers with the match’s maternal grandfather’s name and found a 1952 obituary that mentioned the grandfather as a brother to the deceased, who was a 9 year old boy. The obituary mentioned the parents of the deceased as Mr. and Mrs. H. Markham and several siblings. A couple of the siblings with that same surname (Markham) and a few others carrying the same surname as the DNA match’s grandfather.

I immediately thought that maybe the connection is through Mrs. Markham who was previously married to the maternal grandfather’s father. Near the end of the obituary, it mentioned the grandfather of the deceased – John KAHEAKU. I knew exactly who that was, as he was married to Violet HOLBRON, the sister to my great-grandmother Rose HOLBRON. Incidently, when I searched my database for that couple, I did have their daughter Violet KAHEAKU listed and as having two spouses. With the first spouse, Violet had a 9 year old boy who died in 1952, and that she also married Harry MARKHAM.

So the DNA match turned out to be my 3rd cousin once removed.

While utilizing the longest segment is good practice, once you get beyond the 2nd cousin level, the segment size may not be as large, as in the case of my cousin Angie who is a 3C1R to the DNA match. Sometimes you can also tell by the high number of segments. In my example, I do share less amount of segments but so does my cousin Lani who really isn’t (recently) connected to this new DNA match, or my new found cousin.

It’s still a good rule to go by when you have a lot of 2nd to 3rd cousins, or as in my mother’s case a lot of 1st to 2nd cousins.

Ancestry is finally showing Longest Segment size

I have been waiting and have asked Ancestry for this a few years ago.  Apparently, I was not the only person of an endogamous background who had asked for it.

I went through my list looking for the first known Maori, just to see how large the longest segment would be.  I have always advised Polynesians to look for anything at least 30cM for the largest segment (longest block at FTDNA) or as Ancestry is calling it, longest segment size in order to determine a true 2nd to 3rd cousin relationship.  I know with other endogamous groups they tend to look for something around 20cM.

At Ancestry, you will have to click on that match’s name in order to see the longest segment size.

Notice how the longest segment size is below 20cM, but based on the total amount shared the predicted relationship is anywhere between a 2nd – 3rd Cousin.  To show you what that looks like against known 2nd to 3rd cousin relationships, I am showing my match list about where the endogamous matches come in.  I indicate the Hawaiian ones versus the Maori ones and my known cousins.  I am inserting the longest segment size since you cannot initially see it on your list until you click on the match.

While I have a lot of 3rd cousin matches, my mother and one of my cousins have a lot of 2nd cousin matches.  My cousin had over 500 of 1st – 2nd Cousin predicted relationships.   Just looking at her top matches, I indicated the known relationships versus any Maoris and Hawaiian that she matches.

This definitely will help with determining the endogamous matches.  But the longest segment size does get smaller the more distant of the relationship becomes.  So by the 3rd to 4th cousin level, you may not really be able to tell, with the exception of the fact that we tend to get a lot more segments.

I have a 2nd cousin of whom we do not share a lot of DNA.  While we still share in the range of what is expected for a second cousin, the longest segment size is just over 20cM.


At least sorting through these matches have become easier now that we have this additional feature.  Again, this works well with the closer predicted relationships.  This may not be as useful if you already have a lot of distant matches and your Polynesian matches fall within that range.  A lot of my western Polynesian (Samoans and Tongans for example) matches are in that range.

Below are some of my Samoan matches and while their total shared is not a whole lot, their longest segment size is significantly smaller compared to what we normally see with eastern Polynesians.  This is true with other DNA companies like FTDNA and 23andme.

My top FTDNA matches where the endogamous matches come in among my known relationships.

I am hoping that in the near future Ancestry will put the longest segment size immediately on the match list page so it will be easier to go through rather than click on each name to see if the match really is worth looking into.    For now, what we have is definitely an asset to help us sort through these matches.

Separating maternal matches from paternal matches

A problem that endogamy presents is when you have a match who matches you on both your paternal and maternal sides of the tree.  If you do not know how you are related, figuring out the connection is challenging.

Working out how matches for my mother are connected can be difficult.  Both of her parents were Kanaka Maoli.  So unless they have trees or I have the motivation to trace a match’s ancestors beyond what they already have, I usually would ignore the match. It takes a lot of work to distinguish if the match is related on my mother’s paternal or maternal side.

While it is only my mother who comes from an endogamous background, my father, on the other hand, was Filipino and I get very distant matches on that side.  And like my endogamous side, I pay no attention unless the match has a tree where I could figure out our connection.

Being from Hawai’i, I do encounter a lot of matches who are like me where they are part Filipino and part Kanaka Maoli.  I have seen a few matches whose trees indicated ties to the same island as my Filipino grandmother.  For their Hawaiian branches, they may or may not show the same geographic area where my Kanaka ancestors lived.  For the most part, we do tend to match on a DNA level because of the endogamous side as I mentioned earlier, the matches on my Filipino side are usually distant.

Here I demonstrate showing my closest cousins on my Filipino side, and how they can easily match up relatives on my Kanaka side.  Basically, my mother matches a few of my cousins on my father’s side.  It is because my Filipino cousins are also part Kanaka Maoli, and they are connecting to my mother via that side.  Of course, something like DNAPainter or Kitty Cooper’s Segment Mapper could be used to show which segments are from my father versus my mother.  But the point here is to just compare how my paternal cousins also match my maternal cousins.

Paternal cousins indicated in RED and maternal cousins in BLUE.


I indicate the relationship (for the ones without names) how they are related to me, e.g.  1st cousin (1C), 1st cousin twice removed (1C2R).

For my maternal cousins in blue, I list how much they share with my paternal cousins.  But for my mother and myself, I show how much we share with both my paternal and maternal cousins.  In some cases, my cousins on my mother’s side have other endogamous (Kanaka) lines so they might share more DNA than expected compared to another closer relative of theirs, or even to my mother.  For an example, take a closer look at cousin #6 and to their parent cousin #5.  Another example is cousin #3 and #4 compared to my mother.

In the example above I only used my close paternal cousins, and know how we connect.  But when dealing with distant matches and no trees, it will be difficult to differentiate paternal versus maternal matches.

This does not include recent pedigree collapse where I do have on my Filipino side cousins who share the same common ancestors more than once, or where I have cousins who are related to each other in more than one way.  This can also affect the amount of DNA shared.

Ancestry updates their ethnicity yet again

As of November 13, 2019, everyone’s AncestryDNA results were updated.  Back in late October, only a few people have been getting the new update and all new testees.  Now we are all on the same page.

They did several changes which include increasing the number of genetic communities for various populations, increasing the size of their reference samples, renaming of categories and adding in a few new categories such as Guam, Samoa and Tonga.

We are going to concentrate on Samoa and Tonga, which they attempted to split off from the rest of Polynesia.

When AncestryDNA created the Polynesia category back in December 2013, it only consisted of 18 Polynesian samples which included at least one (or possibly more) of the samples that have distant European ancestry.  They updated their category and rolled out the new update to everyone back on September 12, 2018 with an additional 40 more samples increasing to a total of 58 for Polynesia.

In June and December 2018, I had the opportunity to speak to David Turissini, Ph.D who is a population geneticist at AncestryDNA.  I expressed my concerns with him regarding more specific categories among Polynesians.  Basically splitting eastern from western Polynesia.  I also explained why I thought that would be much better for us particularly for matching as we all tend to match each other at a very closely predicted relationship.  And that I thought the low number of reference samples could possibly affect the way we get our results.

He told me that I already understood how Polynesians lack genetic diversity so increasing the number of samples would not make any difference.  But then I pointed out how it was not that difficult for me to distinguish a western Polynesian (Samoan, Tongan, Tokelau, Tuvalu) versus an eastern Polynesian (Maori, Tahitian, Cook Island Maori, Hawaiian, Marquesan, Rapa Nui).

Despite all that was said, I was surprised to see how they increased the number of reference samples for Polynesia along with adding in Samoa and Tonga.

New categories & increase of samples for Polynesia

You can read more about it here:

https://www.ancestry.com/cs/dna-help/ethnicity/estimates

So their reference samples of 16,638 has increased by 23,379 samples to a total of 40,017.  Of that amount, they added 130 more samples to the Polynesia category and creating Samoa with 73 and Tonga with 97 samples.

While I have not noticed a lot of Tongan results yet, I have seen several Samoans.  Most of the ethnicity results I have seen are either Hawaiians or Maoris.  For the most part, eastern Polynesians are getting either Samoa and/or Tonga in the range of 1% – 4%.  For Samoans, I’ve seen about 60% – 70% Samoa and the rest Tonga.  A few Cook Island Maoris seem to have a higher percentage of Samoa compared to other eastern Polynesians but that may be due to the fact that they have ties to Aitutaki or its neighboring islands versus Rarotonga.  Or maybe Cook Island Maoris just have a higher percentage because of another group of people that settled earlier and/or it could be due to the original people who just so happened were genetically more like Samoans.

This whole classification, while it cannot be accurate as it is nothing but an estimate, really makes it interesting and gives us a bit more of an insight as to the settling of Polynesia.  Of course we can also see this as more people are getting Y-DNA tested and mtDNA and we slowly learn more about these different migration patterns which no surprise, confirms our oral histories.

My results have changed throughout time since I tested with AncestryDNA back in January 2014.  The biggest breakthrough came last year as they actually created the Philippines category which correctly allocated my Filipino side from Polynesia, therefore decreasing my amount.

But what does my tree look like compared to my current DNA results?


With the latest update it made my color scheme more difficult to accomplish but in the tree I do point out the foreigners.  While my father was born in Lahaina, Maui, Hawai’i, both of his parents were from the Visayas region in the Philippines.  For my maternal grandmother’s mother – Rose Holbron, her paternal grandfather was from Hull, England while her maternal grandfather was from Queens, New York, U.S.A.  And for my maternal grandmother’s father – Frank Kanae, he had distant American ties.  His great-grandfather Isaac Lewis Kanae was the son of Captain Isaiah Lewis.  I still have not pinpointed his origin yet.  And Isaiah Lewis’ father-in-law Oliver Holmes arrived in the Hawaiian Islands in 1793 from Plymouth, Massachusetts.  At the time Oliver Holmes left Plymouth, there were only 15 states in the U.S.A.

So what I did was place their ethnicities under a continental level and compared it to my DNA results, which all adds fairly nicely, taking in random inheritance.  My mother gets 17% European compared to her sister who gets exactly 15% which is consistent with the genealogy.  And in turn my mother gave not one but both of my brothers about half of her European – 8% and 9% for them while I ended up with the higher percentage – 11% which appears as about 11% – 12% at different testing companies.

And while I show 2% Samoa, my mother ended up with 1% of both Samoa and Tonga.


For my cousin who is not admixed, it was interesting to see, despite the erroneous genetic communities that would come up, how hers changed.  Because we match other Polynesians at a very closely predicted relationship, and the fact that my cousin is not admixed, she matches a lot of part Polynesian people who fall into a specific genetic community among others of whom she also matches.  So she ends up with the same genetic community.


With this latest update, they finally got rid of the Native American category for both my cousin and my mother.  But now with Samoa and Tonga, it is no surprise that they would give us a small percentage of that.  And having gone through several of these 1% – 2% categories of Samoa and Tonga, they all seem to range the same – 1% – 4%.  Interestingly for my mother, her range for Tonga was 1% – 3% while her Samoa was 1% – 4%.  But the way it ended up was both 1%.

I have also been witnessing those who previously had small amounts of Polynesia now being reclassified as Samoa, Tonga or Guam.  Usually, these are people with either Melanesia or some other Southeast Asian from various parts of Indonesia.  I would be really interested in seeing more results who have ties to that area.

So while I was told the number of increase of samples would not do anything, it obviously did quite a bit.  If only they would have renamed the Polynesia category by specifying Eastern Polynesia.  They should also do the same renaming their genetic community.  It would make more sense as we know that both Samoa and Tonga is part of Polynesia and of course, their map for Polynesia would include Samoa and Tonga within that area.  I would have expected western Polynesia as I mentioned to them versus eastern Polynesia, but they really got very specific.  And in the end result, Samoans will see that they are about 30% Tongan and probably the same for Tongans where they will see a smaller percentage of Samoa.  These people do get about 0% – 1% Polynesia in their results.

We will just have to wait to see what the future updates would bring.

Previous entries about AncestryDNA’s Polynesia category:

https://hawaiiandna.wordpress.com/2014/12/15/polynesia-category-ancestrydna-com/

https://hawaiiandna.wordpress.com/2015/06/30/polynesia-category-ancestry-com-part-2/

MyHeritage Ethnicities

As of May 30, 2017, MyHeritage finally released their Ethnicity Estimate (beta) to those who uploaded their raw data.  So far this service is still free.  Not sure if they will discontinue that service.  Currently their tests are at a reduced price of $79.


Not only does MyHeritage (MH) have an Oceanian category but they included Polynesian along with Melanesian and Papuan.


Last year and probably the year before that, they reached out to people who had a tree at MH whose 4 grandparents were listed in a given geographic area confirming ties to that particular place or country.  And while they seem to have obtained more than Ancestry’s 18 Polynesian samples, they did not take into consideration that these people may be admixed.

A lot of admixed Polynesians who did test with MH are reporting to have lost a lot of their European while simultaneously having an increased percentage of Polynesian.  There seems to be about 10% difference.

Here are my mother, my maternal aunt and my own results.

Click for larger image

My mother and her sister are 85% Hawaiian while 15% is of European background.  My mother gets about 17% European at the varying DNA testing companies.

Several Polynesians have shared their Ancestry results with me.  Comparing it to MH it seems that the numerous samples that they used for the Polynesian category included some admixed Polynesians of European heritage.  I have been hearing the same situation for those with admixed Native American background reporting 20% to 30% more Native American while reducing the amount of European.

What is interesting about MH is that they did have other populations not covered by the other testing companies.  They separated the Melanesian and Papuan, commonly grouped together and labeled as “Oceanian” by other companies or at GEDmatch, and provided a separate Polynesian category.  They did something similar for the Asia group.

MH has specific groups within the Southeast Asia area, such as Filipino, Cambodian, Vietnamese, Thai, Malaysian and Indonesian.  While the thinking is that if you come from that particular background which they tested, you should score perfectly with that group.  This may not apply for some either due to the limited number of samples and/or where they got their samples from, such as taking samples from one specific area.  I have only seen a few Filipinos’ results where they score 100% Filipino/Indonesian/Malaysian.  A couple of Chinese people received majority Chinese and Vietnamese and a smaller percentage of Filipino/Indonesian/Malaysian.

My guess is that this breakdown of the various Southeast Asian groups helps separate Polynesians (and Micronesians) who also have some Southeast Asian background.  At Ancestry, Chinese people were reporting about 10% Polynesia, Vietnamese as high as 15% and Filipinos around 32%.  Ancestry has no Southeast Asian category, so those of Southeast Asian background will get some of the East Asian, or what Ancestry has as “Asia East” along with a small percentage of Polynesia.

Aside from MH engulfing the European for admixed Polynesians, it seems fairly accurate at least for me being that I am half Filipino and 43% Hawaiian and about 12% European background.  I am going to assume that the West Asian below is part of my European background while the South Asian is part of my Filipino backgroundc

New 5th Cousin connection helps map out chromosome!

HOW WE CONNECT

Now that I had figured out who my mother’s biological parents were it has become easier to find connections.  (You can read about it here: https://hawaiiandna.wordpress.com/2015/08/01/finding-a-dna-connection-despite-endogamy/)

While there is one branch where I find a lot of relatives on my great-grandmother Rose Holbron’s side, I am slowly finding distant connections on my great-grandfather Frank Kanae’s side.  Frank Kanae was Rose Holbron’s husband.

Earlier this week I received an email from a woman named Raychelle who saw me and my numerous kits of family members that I manage on GEDmatch.com as a match to her.  I began the normal response, almost ready to dismiss her since many of these matches appear to be close when in reality we are usually distant, and for others, much more distant.  And from what I could see, it wasn’t such a huge amount.  At GEDmatch, Raychelle and my mother shares 62.9cM total, with a large segment of 10.7cM.  So at least a 4th cousin level.

After I told her that she could find me on Ancestry (since she uploaded to GEDmatch via Ancestry) and look at my HOLBRON family tree, she found out that we have the LEWIS connection.

She is a 5th cousin to my mother, and a 5th cousin once removed (5C1R) to me.  I come from Isaac Lewis who was known as Isaac Lewis Kanae or Isaac Kanae Lewis, and also known by the Hawaiianized version – Aikake Lui.  While Raychelle comes from John George Lewis, and his Hawaiianized name was Keo Lui.  My assumption is that Keo was short for Keoki (George).  Keo could also be short for Keoni (John) and then there was the catholic version – Ioane for John.

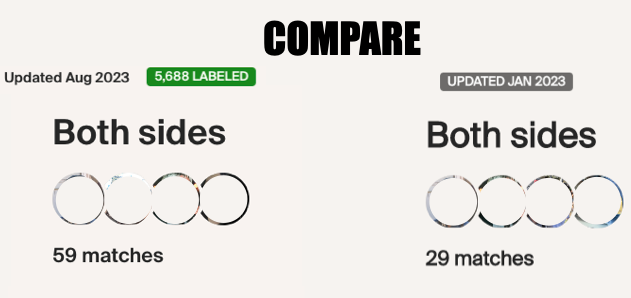
But what was interesting is that she had this genealogy and I had updated mine from this to reflect what a couple of people have been researching.

According to the information that has been circulating at various sites on the internet, Isaac’s father – Captain Isaiah Lewis was the son of Captain Ezra Lewis.  And John G. Lewis was the son of Captain John Lewis, who was Captain Ezra Lewis’ son but through a different wife.  I listed them as spouse #1 and spouse #2 because different sites and people will switch the spouses showing Isaac as the son of one spouse, and another will show Isaac as the son of the other spouse, and vice versa for John G. Lewis.

Click to see larger image
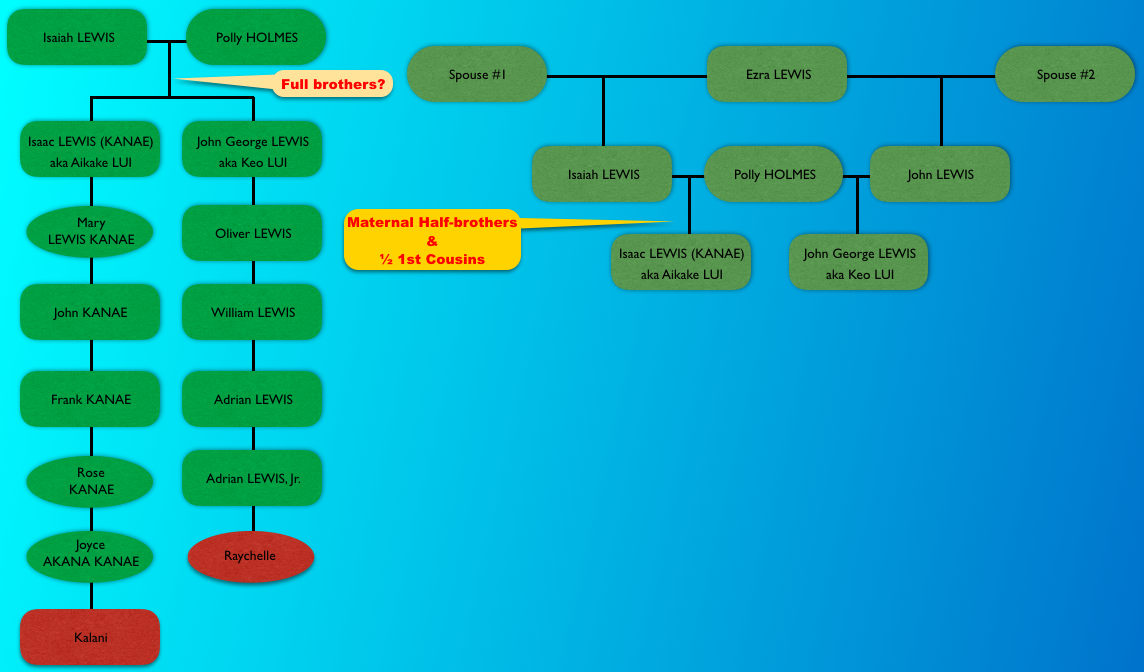
So the question is, were Isaac and John full brothers, or (maternal) half-brothers?  And if they were (maternal) half-brothers, were their fathers paternal half-brothers?

While all of this information going back that far is based solely on people creating these trees without further documentation, for now I am only going by what was documented.  The trees habitually say that Polly was known as Sarah Pauline “Polly” Holmes.  While I can understand that Polly could be a diminutive for Paula and Mary, I’m not so sure that these are the same person, especially since a lot of the information lists this Sarah Pauline “Polly” Holmes having been born in Massachusetts and died there,  and that her husband Captain Isaac Lewis from Massachusetts too.

What we know for a fact according to testimonies from people who lived during the time of Polly Holmes and her father Oliver Holmes.

screen-shot-2016-12-02-at-12-32-31-pm

I am still in the process of confirming and documenting all of these ancestors, so for now I am considering Raychelle and I 5C1R, and that her 3x great-grandfather John George Lewis (Keo Lui) and my 4x great-grandfather Isaac Lewis Kanae (Aikake Lui) were full-brothers.


SHARED DNA SEGMENTS & CHROMOSOME MAPPING

I compared Raychelle to all of the relatives to see which segments we all had in common.  Any common segments or segments that multiple relatives share would indicate that segment was inherited from a common ancestor.  In this case, Polly Holmes and her husband Isaiah Lewis.

And while autosomal DNA inherited from our common ancestor can remain in our genome for about 5 – 6 generations, there are some cases where it can span several generations and for some as we have seen, in larger segments. These larger segments tend to be passed on within generations entirely intact and having not recombined.

With endogamy, that may confuse things as it isn’t guaranteed that the shared segment came from that same common ancestor.  Especially for Polynesians where we share many small segments.  And these multiple segments may not be in common with other relatives, or rather these segments may not overlap as what I am about to demonstrate.  So when looking to map out these segments, and at the 4x great-grandparent level, if the segments are really small, that may be suspect to being segments randomly inherited.  It may or may not be from the common ancestor, or may come from the same common ancestor multiple times through their different descendants.

I first compared my brother Kaimi and Raychelle and looked for the chromosomes that should match my mom.  Kaimi and I have different fathers, so I decided to use his to compare because his father is also Hawaiian.

I use Kaimi’s unphased and phased data to be sure that if there are extra segments that does not match our mother, then the presumption is that the segment came from Kaimi’s father.  These were the results.

screen-shot-2016-12-23-at-2-08-35-pm

You can easily see how with the phased data the size of the segment is somewhat smaller if it doesn’t remain the same or disappear altogether.

The real work comes in when I compare Raychelle to my mom’s brother’s son Chris, her half-brother’s daughter Lena and her maternal half-sister Aunty Stella.  The detailed specification of their relationship is to help you understand how they are related and know what is to be expected as far as sharing DNA with different relationships go.

What I did first was compare Raychelle to all of those family members mentioned and then see which of those matching segments actually matches up with what my mother matches.  Here’s a diagram of how we are related and descend from Isaiah Lewis and Polly Holmes.

screen-shot-2016-12-03-at-6-55-03-pm

I’ll start first with Chris, the son of my mother’s brother Joseph.

screen-shot-2016-12-04-at-7-33-00-am

While there were other segments that Raychelle shared with Chris, I am only comparing overlapping segments that are shared with my mom.  There are 3 chromosomes where they share overlapping segments.  Ch 6, 7 and 20.

With Aunty Stella, there were segments on different chromosomes, sometimes on the same chromosome but in different parts of the chromosome that did not overlap.

screen-shot-2016-12-04-at-7-45-56-am

Only one overlapping segment which is on ch 7.

Then with Lena, the daughter of my mom’s half-brother George.

Lena also shared different segments and different chromosomes with Raychelle that my mom does not have, except for ch 7.

So what is consistent with all of them is that a segment on chromosome 7 is shared with Raychelle.

The diagram above  shows how everyone matches each other, with the last one again showing my mom with Raychelle and that consistent block of segment.

So the fact that we all shared an overlapping segment in common with each other indicates that particular segment was inherited from our common ancestor.  In this case, both Isaiah LEWIS and Polly HOLMES.  But how do we figure out if that segment came from Isaiah vs. Polly?  Remember that there was a discrepancy that Polly’s two husbands – Isaiah LEWIS and John LEWIS were paternal half-brothers according to some other genealogy and that Isaac LEWIS KANAE was Isaiah’s son, while John George LEWIS was John LEWIS’ son.  Both Isaac and John had the same mother – Polly HOLMES.

The best way to distinguish that inherited segment being inherited from Isaiah LEWIS or Polly HOLMES is to test members of each of those families.  That would be distant relatives of whom we cannot find a connection to just yet.  Instead, I used another method.

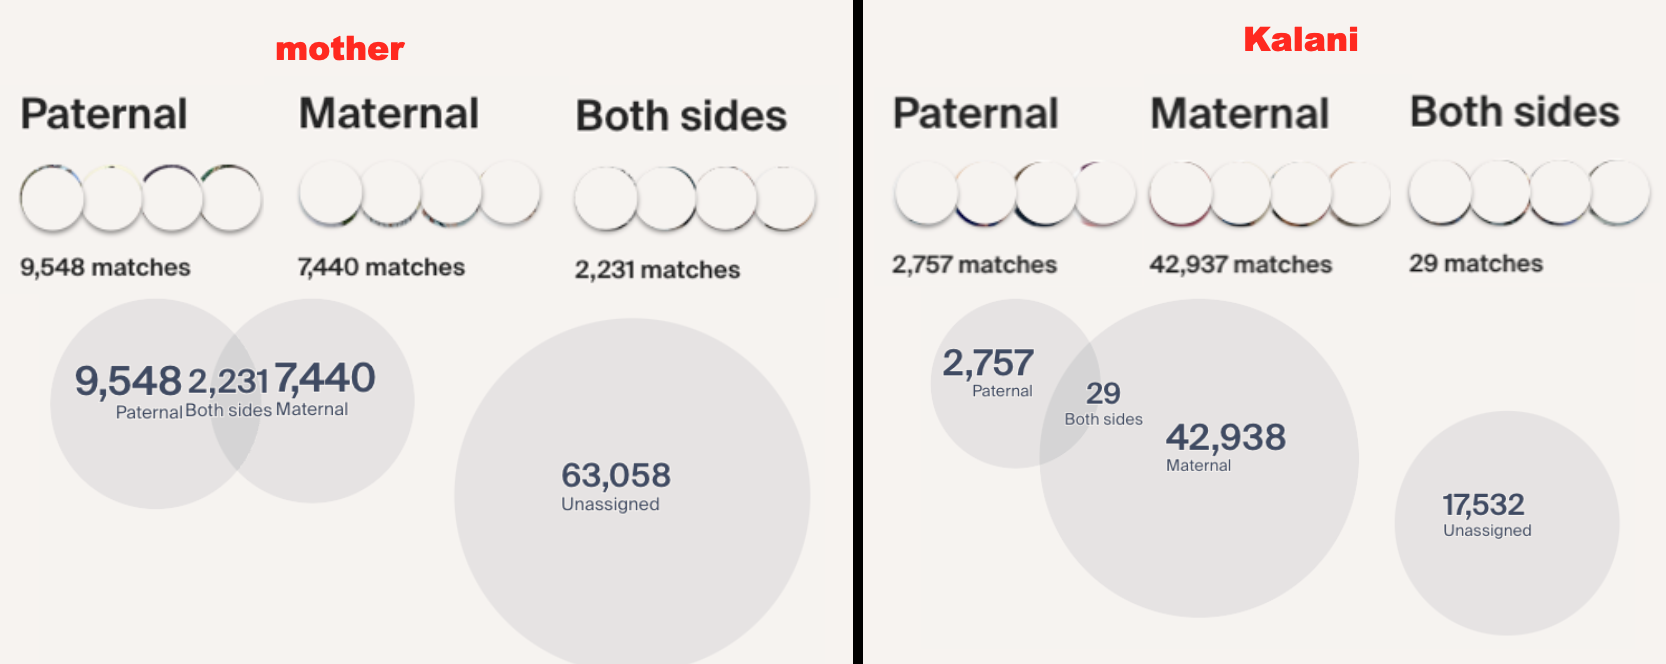
Since my mother tested at 23andme, they have the ability to show the ancestry broken down by each chromosome. This is what my mother’s 7th chromosome looks like.


screen-shot-2016-12-03-at-7-36-33-pm

23andme identifies portions of the Hawaiian segments of the chromosome as a combination of East Asian & Native American, and Oceanian.  I simplified it by just indicating Hawaiian.  Both of my mother’s parents were Hawaiian, but her mother Rose KANAE also had European ancestry.  Which is why in that diagram one chromosome is labeled as the paternal chromosome, the other as the maternal.

My mother’s maternal grandmother was Rose HOLBRON.  Rose’s paternal grandfather John HALBORN was from Hull, England, and her maternal grandfather William LUDLUM was an American whaler from Jamaica, Queens, New York.  Rose HOLBRON’s grandmothers were Hawaiian (Kanaka).

But it is Rose KANAE’S father – Frank KANAE whose paternal grandmother Mary LEWIS KANAE’s father was Isaac LEWIS KANAE.  Isaac’s father was Captain Isaiah LEWIS.  Isaac’s mother Polly HOLMES was the daughter of Oliver Holmes of Kingston, Plymouth, Massachusetts and Mahi, daughter of the chief Kalanihooulumokuikekai of Ko’olau.  My assumption was that the European portion from Rose KANAE’s father is too far back.  In other words, the European portion of that chromosome that my mother inherited from her mother could have only come from John HALBORN or William LUDLUM, or a combination of both.

There are a few factors that could make a segment remain in tact for several generations:
1) The length of the chromosome.
2) How many cross-over events there were for that particular chromosome.
3) Location on the chromosome (some areas are more SNP dense than others).
4) The possibility of having fewer cross-over events or none at all (we see this happening as well).
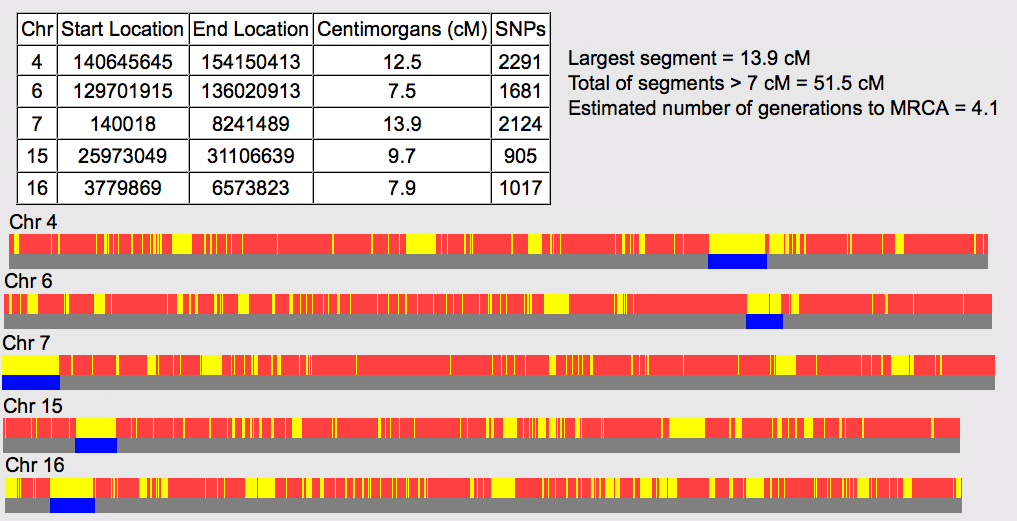
This segment seems to match nicely ranging from 7.1cM (my mom) to 9.1cM (Aunty Stella) with all the relatives.

So when I visually compare the section of chromosome 7 that matches up with the shared overlapping segment for all of us, this is where they line up.


If you have read my other posts, you would have read that multiple segments for Polynesians can remain for awhile given that we come from a few common ancestors multiple times.  This paritcular segment had to have come via Polly HOLMES’ mother – Mahi who got it from her parents Kalanihooulumokuikekai and his wife.  And since Raychelle is also a descendant of Polly HOLMES and Isaiah LEWIS, this portion of chromosome 7 did not come from my HOLBRON side.

While my family members used for comparison descend from Isaac LEWIS KANAE’s daughter Mary LEWIS KANAE, there are other descendants through Mary’s sister Papanaha LEWIS KANAE who got DNA tested.  But only one of them was a match to Raychelle.

screen-shot-2016-12-04-at-4-00-56-pm

This cousin shares an overlapping segment of 8cM on chromosome #7.  But when I compared that relative to my mother, they did not share that particular overlapping segment, although all my other close relatives did share that overlapping segment with this cousin.  After looking into it further, I found out that my mother seemed to have inherited a smaller section of that overlapping segment compared to other family members, and her matching criteria just did not qualify as a match according to GEDmatch.com where all of this analysis was done.  After all, she shares the least out of all the relatives only 7.1cM of this segment and Aunty Stella shares 9.1cM.  And while she gave me and my brother Kaimi this segment, my brother Travis did not inherit this segment.  Which means this portion of chromosome 7 for him was from our grandfather, not our grandmother Rose KANAE.

But that is what is complicated about mapping out segments for Polynesians. These segments could be from any of these lines going back to the same common ancestor multiple times. That means that Raychelle could just so happen match all of us via my maternal grandmother Rose KANAE’s mother’s side, or my great-grandfather Frank KANAE’s mother’s side, or John KANAE’s father’s side, and so forth.  It could also be just by chance, that we share the segment with any other of her Hawaiian ancestors.

Since many Polynesians share multiple small segments and as small as 7cM, as well as having these segments line up very close to each other if not right next to each other, it makes chromosome mapping very difficult to do.  For example, I mentioned one of Papanaha LEWIS KANAE’s descendants share that same overlapping segment on chromosome 7 with the rest of us, while the other descendants  share multiple non-overlapping segments.  I cannot easily assign them to our common ancestor – Isaac LEWIS KANAE, or presume that all of these multiple segments came from our common ancestor.

Since Polly HOLMES is 6 generations away from my mom and all of her descendants share this same overlapping segment, it is safe to presume that this segment came from Polly HOLMES’ mother – Mahi.  And now I can assign at least this small portion to Mahi.

screen-shot-2016-12-04-at-4-11-13-pm

Some Runs of Homozygosity but no relation

Last year I blogged about GEDmatch’s “Are your parents related” where it looks for Runs of Homozygosity or identical alleles on paired chromosome that would indicate a possible close relative.

But now that I have found & confirmed my mother’s biological parents, I took a look again at GEDmatch’s “Are your parents related” tool to see their predicted genetic distance.

Are your parents related?
It estimated 4.1 generations to the MRCA (most recent common ancestor).  I normally do not go by GEDmatch’s predicted estimated number of generations but in this case because I cannot determine whether 51.5cM is a lot or not, and if 13.9cM largest segment plays a pivotal role or not, I am going by their estimated number of generations.

This is my mother’s genealogy.  I italicized all females.

Genealogy1) Mahi – Ko’olau, O’ahu
2) Kumahaulu – O’ahu
3) Kaapuiki – Kapa’ahu, Puna, Hawai’i
4) Piipii – Puna, Hawai’i
5) Naea – no information
6) Kamau – Hau’ula, O’ahu
7) Ehu – Mapulehu, Molokai
8) Kalahope -Pulama, Puna, Hawai’i
9) George – Kalapana, Puna, Hawai’i
10) Laahiwa – Kalapana, Puna, Hawai’i
11) Hookano – Honomuni, Molokai

These are my Kanaka or aboriginal Hawaiian ancestors.  The people I specifically chose were at the end of my genealogy branches.  I’ve listed their known origins with the names of the place (ahupua’a), district and/or island.  The main thing to look for is that both of my mother’s parents Joseph and Rose just do not have families coming from the same areas.

My grandfather Joseph’s family was from the island of Hawai’i.  Rose’s paternal grandfather John was from Molokai as well as his wife Hookano.  Ehu was also from Molokai while Kamau was from O’ahu.  It is not clear where John’s father Naea was actually from.

The point of all this is to show how contrary to predicted closeness with all of these DNA companies and even a tool to look for ROH, that there is still no known close connection to my grandparents.

East Asian category for Polynesians

My mother told me today that she received from the First District Circuit Court that handled her adoption, the non-indentifying form, which is where it lists her biological parents’ ancestries.  They indicated that both parents are Hawaiian and Chinese.  I find that to be an error since my mother had her DNA tested at 3 companies.  Maybe that was based on an assumption or the biological parents may not have known too much about their ancestries.

At the age of 5, she met her biological father and described him as a “pure Hawaiian.”  This made sense since she gets the following percentages from each company.

Screen Shot 2015-07-13 at 3.25.31 PM


So this meant that one parent was just Hawaiian while the other parent was admixed with some European.  Based on all the companies she has tested with and analysis [from Dr. McDonald], my mother gets the following averages.

European = 16%
Oceanian = 25%
East Asian = 55%

Those are based on 23andme, FTDNA’s old Population Finder and Dr. McDonald’s analysis.  FTDNA’s current myOrigin lumped their former Oceania category under Southeast Asia, or the more broader East Asian category.  AncestryDNA however created a Pacific Islander category with the subgroups Polynesia & Melanesia and between myOrigins and Ancestry, the average total is 83%.

In reality, the East Asia category is just one of two components that make up the genome of Polynesians.  The other is Melanesian/Papuan (Oceania).  For Polynesians, autosomally they are 79% East Asian and 21% Melanesian1.

In Population Genetic Structure and Origins of Native Hawaiians in the Multiethnic Cohort Study they applied ADMIXTURE on genome-wide SNP data to finely estimate the degree of admixture in Native Hawaiians.  They found that with Native Hawaiians, “an average of 32% and 68% of their genomes to be derived from Melanesian and Asian origins, respectively”.  But that “[r]ecently, Kayser et al. surveyed the nuclear genome with 377 microsatellite markers in 47 Pacific Islanders and identified 79% Asian and 21% Melanesian proportions of ancestry for Polynesians.”

So while other studies revealed that Polynesian genome consist of 79% Asian and 21% Melanesian components, the study with Hawaiians averaged 32% Melanesian and 68% East Asian2.  The higher amount of Melanesian could be attributed to the repeated bottleneck effects throughout the centuries specifically for eastern Polynesians, i.e. French Polynesians, Rapa Nui, Cook Island Maoris, Maoris from New Zealand and Hawaiians.

My mother averages 25% Oceanian and 55% East Asian.  The two combined equals 80%.  25% (Oceanian) is 31% of the entire Polynesian (80%) percentage.

Just over a year ago I was going through my mother’s matches on GEDmatch and began running their kits through various admixture tools to see their totals of Oceania versus East Asia.  I wanted to see if they fell within the 27% to 32% Melanesian/Papuan/Oceanian.

Screen Shot 2015-07-13 at 5.20.34 PM

This is only a partial list.  There are more lines on the bottom but I am just showing the first several.  I use various calculator admixture tools at GEDmatch that had the specific Oceania/Papuan/Melanesian category.  Dodecad World9 uses “Australian” instead. I created a column that totaled the average.  And the columns to the right of that shows those who tested at other companies and their Oceania percentages.  What is not shown in the list is the proportion of East Asian that would prove it does fall within the 27% – 32% Oceania.

The first row (in red) belongs to my mother, followed by my averages and then my brother’s.  The following lines in bold are for those at least 95% Polynesian.  I took the lowest and the highest percentages of Oceanian to see if it falls within the range consistent with the research.  Since these admixture calculators did not have just a single East Asia category alone, I listed the other categories that are known to split off from the East Asia category.

Eurogenes K9b
Oceania = 17.74%
Southeast Asian = 48.87%
Northeast Asian = 13.32%
Native American = 1.55%

Adding the Southeast Asian, Northeast Asian and Native American categories total 63.74%.  17.74% Oceanian makes up 27.8% of the total (East Asian compiled categories) of the Polynesian genome.  Consistent with the research.  Looking at the highest percentage.

MDLP World
Melanesian = 20.78%
East Asian = 56.31%
Artic Amerind = 1.65%
Mesoamerica = 0.13%

There was an Indian category showing 3.74%, but I did not add that in.  Adding it, changed the overall percentage to 33%, but leaving it out made it 35.7% of the Polynesian portion. For the others listed on that list, they also picked up a small 1 – 3% of the Indian category, and leaving it out made their average 30%.  If I look at the average column for all the admixture calculators for my mother, it comes out to 30%.

But what happens when there is a higher percentage of East Asian?  In my case, it is higher because my father was Filipino. My portion could easily be verified simply by removing 50% (my father’s contribution) from my average total of 85% East Asian giving me 35% East Asian that would be my Hawaiian/Polynesian side.  My average (GEDmatch) showed 32%.

There are many Hawaiians admixed with Chinese, Japanese, Filipino or Korean, being that they were all immigrant groups to the Hawaiian islands.  Are you able to tell if they have an Asian admixture?  Can it be distinguished from the East Asian that is part of the Polynesian genome?  This is something I have been seeing more now particularly with adoptees.

Any excess East Asian percentage  compared to the Oceanian percentage [79% to 21%], would indicate that the person is admixed with some other Asian ancestry.  Since my mother’s genome does not indicate any more East Asian than what it should for Polynesians, it is clear that she does not have any additional Asian ancestry.

Footnotes

1. Genome-Wide Analysis indicates More Asian than Melanesian Ancestry of Polynesians
2. Population Genetic Structure and Origins of Native Hawaiians in the Multiethnic Cohort Study