AutoCluster Endogamy tool at GEDmatch.com (Part 3)

Continuing on with GEDmatch’s AutoCluster Endo tool, as I play around with the settings.  I kept adjusting my mother’s kit and could not find the right settings.  Basically, I could not produce any clusters simply based on the settings expected with non-endogamous populations.

What I ended up doing was adjusting the Min average segment cM lower and lower (from 15cM down to 9cM) each time until I got it right at that threshold where I knew it would produce the larger (endogamous) cluster.

I repeated the same thing under Shared Match Filter by selecting 9cM (screen shot shows 10cM which is what I used for myself) for Min average segment cM

So with my mother, it seems that she currently does not have any decent size matches to cluster.  I would have noticed that since I normally would sort her matches (as well as my own) by Largest Segment size.

Interestingly with my own matches, I noticed something unique and unexpected and I know it had to do with the Shared Match Filtering which I will go over in a bit.

But first I want to stress the importance of knowing what the Min average segment cM would be and why.  Again, given the past 11 years I have been trying to weed out all endogamous matches, and I have noticed that the largest segment size for many of the matches rarely exceeds 12cM.  I noticed this at FTDNA, 23andMe and at GEDmatch.

I was able to go through my Ancestry matches, also the same for my mother and one of my cousins and have seen what that average size looks like.  So taking a closer look at what that looks like (using Ancestry matches as an example).

Whether it is in the predicted 2nd cousin range, 3rd cousin, 4th cousin, or distant cousin, the average size you will see (based on the total shared cM divided by the number of segments) is around 8cM.  I identified my endogamous matches in the closer (2C range), but never completed the entire lengthy list going down to the 4C range except for the known relationships where it is highlighted in yellow.

I highlighted an actual 2C1R who falls in that predicted 4C range (remember that at the 3C level, you will not match about 10% of them) and whose average segment size is 8cM.  While those numbers (total shared divided by #segments) seem to be similar to the other matches in that range, the longest segment size is more than 20cM.  That is something that we rarely get, at least with this closely predicted range.  This relative does have a few other lines or branches that are of the same endogamous background, which explains why there are many segments.

Now take a look at one of my cousin’s average size segments even with their endogamous matches predicted to be in the 1st cousin range.

That average segment size is still 8cM due to the number of segments for that given total shared cM.  These are a cousin’s matches so I did not take the time to highlight and identify their known relatives, but it should be obvious which ones are the true, close relatives.

Okay, now that the average segment size is defined, and identified why that number is what we see, you have an idea what number to utilize (assuming that your average segment size is also below 12cM) in this tool and what amounts would remove all the endogamous matches.

These are the results for my matches utilizing the 10cM average size segment.  It’s not too small, although I could have easily made that slightly larger, like 15cM.

(Sidenote, you can easily zoom in & out of the cluster.  So having a lot of matches in a cluster and trying to reduce it is a plus!)

So it divided my grandfather’s matches (blue) from my grandmother’s matches (orange).  But if I took a careful look at just my grandfather’s side, this is what I noticed.

Focusing on the blue cluster first, I have a pair of 2nd cousins who are siblings (indicated in white) and another 2nd cousin and her 1st cousin 1x removed (my 2C1R) in the blue cluster which is my grandfather’s side.  The two white 2C’s grandmother, and the other 2C’s grandmother (the 2C1R’s great-grandmother) were sisters to my grandfather.

Then we have the 2C1R in red whose grandfather was a brother to my grandfather’s mother.  The (yellow) 2C2R was a 2C to my grandfather.  But here is a clearer picture of how each match is connected to me and each other.

[“k” is kāne or male, “w” is wahine or female]

So going back to that cluster (above), you can see where the problem is where the 2C2R on my grandfather’s father’s side is matching the 2C1R on my grandfather’s mother’s side.

Ideally, the clusters should be separated by pairs of ancestors.


Looking at the details of the two clusters,  I can see why it was able to separate my grandmother’s matches from my grandfather’s.  Remember, I normally do not get any separation when it comes to my maternal side.  Even with my paternal side being a different population, I have paternal relatives whose other side belongs to the same endogamous (Kanaka Maoli) population and can generate gray marks indicating that they are part of more than a single cluster.  Some other endogamous populations will have a lot of these, maybe you might too with your matches.

Only 2 other matches are making up the second cluster.  My 2C and a 3C1R to both me and my 2C.  I share with the 2C a total of 241cM across 13 segments, and the largest segment 40cM.  With my 3C1R I share a total of 148cM across 10 segments, and  largest segment of 40cM.  Comparing those two cousins with each other, they share a total of 108cM across 10 segments, with the largest segment being 26cM.

Since I selected 20cM for the minimum largest segment, it pulled up these actual relatives of mine, all of whom have the largest segment size as small as 29cM, and as large as 41cM.  These high settings helped remove the endogamous matches.  Not only that, it was able to at least separate my grandmother’s side from my grandfather’s side.  What is important to know is that at GEDmatch I do not have any close enough relatives on my grandmother’s father’s side, only on her mother’s side.  Maybe if I had a few close relatives, we could have seen how my grandmother’s father’s side would mix with her mother’s side as well?  Who knows.  It is just amazing to me that this tool, given the opportunity to adjust these parameters could help break the matches into actual clusters.  I am speaking from an endogamous perspective and how we have to deal with the high amount of closely predicted shared matches.

AutoCluster Endogamy tool at GEDmatch.com (Part 2)

In my last blog entry  AutoCluster Endogamy tool at GEDmatch.com (Part 1), I covered briefly about the settings that are adjustable when ready to produce clusters and what is suggested for Polynesians. I also mentioned Leah Larkin referring to different levels or degrees of endogamy based on the average size segment and given that size, what works best or how to approach your DNA matches.  I had to play around with it quite a bit in order to get decent clusters.

First, understanding the high settings put in place when you select “Highly Endogamous.”

So the minimum largest segment is 30cM, which is what I’ve been promoting for nearly 11 years.  This was based on my own observation when I tested a second 1C1R and could compare that 1C1R with another 1C1R who had tested a few months prior, and are 2C to each other.  Given that we have a lot of predicted 2nd to 3rd cousin matches (100cM – 300cM) where the largest segment size rarely would exceed 20cM.  With these two 1C1R who are 2C to each other, I noticed that their largest segment was 41cM.

It wouldn’t be till about 2 or 3 years later when I heard others somewhat following that same analogy and seeing the significance of a largest segment size indicating a closer ancestral connection versus an endogamous one.  This was specific with Ashkenazi Jewish background and how they seem to be set on 20cM.  By this time, I had already determined that 30cM would be best.  Also, with other Polynesians who share a true 2nd to 3rd cousin relationship, their largest segment would be larger than 20cM.  And among all the endogamous matches, it rarely would exceed 20cM.

So that was the reason why I determined that 30cM was a good amount to be used in the Min largest segment cM.  And while this blog entry is specific for this new AutoClustering tool for endogamy at GEDmatch, I have noticed that at MyHeritage, even with the endogamous matches that the largest segment size could exceed 30cM. However, what would also be indicative of an endogamous match vs. a truly close 2nd to 3rd cousin match, is the number of segments.

Taking a closer look and right next to the minimum largest segment size is the number of largest segments.  Thought this was interesting and not sure if it’s necessary or not.


I am assuming that when it asks for minimum largest segment followed by the number of largest segments, that would mean it will have your smallest — largest segment size set at whatever number you have selected, times whatever you selected under number of largest segments.  In other words, if you select 100cM min largest segment size, it will require that the smallest size you have is not smaller than 100cM.  And the number of largest segments, say I select 10, it would require that you have at least 10 segments no smaller than 100cM.

You rarely would get a largest segment of the same size, or at least not that I have seen in both endogamous and non-endogamous matches.  After all, these direct to consumer DNA testing companies are showing you the size of the largest segment that you have among all of the matching segments that you share.  This is probably why I initially was not generating any matches/clusters simply because I had it set to 2.  So my suggestion is to change it to 1.

So all of those parameters are allowed under the Primary Match Filtering section.  Then you have the Shared Match Filtering section which is nearly identical to the Primary Match Filtering section except you also have a minimum shared cM between shared matches which is what you also see when you run an autocluster with MyHeritage or Genetic Affairs directly.

With this parameter, you can tell it how much your DNA matches must share with each other to be considered to be put into a cluster.   And what I did was set it to as low as 100cM since I have hundreds of matches from 100cM up to 200cM.  My advice is that if you’re not admixed, or rather you have less foreign branches, definitely increase that higher than 100cM.  It was easier for me to guess the numbers to use since I know how many matches I have, and out of these varying ranges of shared DNA, how many matches I would have for each.

For example, I have hundreds of matches predicted to be 2nd cousins (Ancestry).  That is I have hundreds of matches sharing as low as 200cM and as high as 649cM.  In the predicted 3rd cousin range I have over a thousand of these type of matches which range from 90cM to 199cM.  And predicted 4th cousins, more than 24,000.  These range as low as 20cM and as high as 89cM.

In my previous post I showed an example of what my autocluster looked like from MyHeritage and that I sorted it (by total shared cM) from the lowest to the highest.  The lowest was 108cM, and from there it slowly went up.  I had 12 matches sharing 108cM.   I also had 12 matches sharing 109cM.  The number of matches sharing about the same amount can be a lot.  So understanding this will help you decide the best numbers or amounts to use when creating your clusters.

I am hoping that others from various endogamous groups start utilizing this new tool and am really curious how it will affect their research, expecting it to be for the better!  Since I am still trying to generate various clusters by constantly adding in varying numbers, I will not be posting any examples of what they look like.  Perhaps in a future blog post I will.

I also noticed that with a list of files when generating these autoclusters at GEDmatch, you also get csv files to be used in Gephi.  I posted samples of that in my post from December 2022 called In-common-with, shared matches, and clustering.  I will have to take time to also try to use these actual clusters and look to see how Gephi renders it.

AutoCluster Endogamy tool at GEDmatch.com (Part 1)

Evert-Jan Blom of Genetic Affairs developed a new AutoCluster Endogamy tool on GEDmatch together with Jarrett Ross of GeneaVlogger. Introducing it as AutoCluster Endo (AutoCluster Endogamy when you see it on GEDmatch) is a modified version of the AutoCluster clustering tool designed specifically for those dealing with endogamous matches. It was created to address analyzing endogamous matches more efficiently by filtering for the most relevant (shared) matches.

Thanks to Jarrett Ross for bringing up specific features he mentions in his video.  It allows you to filter your primary matches by adjusting the average segment size, minimum largest segments, and number of largest segments.  It also allows you to filter by your shared matches using the same filters as for primary matches and in addition, the total amount of shared cM between shared matches.

When I used to run the AutoCluster tool at MyHeritage, I noticed people would post their examples mentioning how endogamous their matches were or how burdensome, and problematic it was to deal with it.  I also noticed a marked difference between their clusters and my own.  For one, they had more than one cluster.  I initially only had a single cluster until I uploaded one of my 1C1R with whom I do not share as much DNA (as expected I guess for someone of that relationship) and was enough for this tool to pick up.  This cousin of mine appeared in my second cluster with other relatives on my paternal (non-Polynesian) side and he also produced gray squares matching several matches in the first/large cluster.

I emphasized in my AutoCluster for others to take note that the minimum threshold implemented was not 20cM or 30cM like many others that I remember seeing.  Mine was significantly higher.

I also sorted my match list showing the lowest amount at the top, sharing 108.1cM, so the 26 matches I decided to show only shows from 108cM to 110cM.  Of course there are 470 other matches that comprise that large cluster.

I kept pointing this out to others, how our minimum threshold will vary across different populations, depending on the amount of shared DNA we have our matches and the number of matches, etc.  There is a bit more freedom with utilizing Genetic Affairs directly.

With this AutoCluster Endogamy tool at GEDmatch, you can do quite a bit.  This tool is offered to Tier 1 subscribers (Tier 1 pay-as-you-go membership $15 per month and Recurring monthly Tier 1 memberships $10 per month) only.

The first thing you will notice is that you have the option to select the level of your endogamy or how endogamous you are.

The default is set to “Not Endogamous.”  While I only tried the “Endogamous” option to see the difference from the “Highly Endogamous” (Polynesians should be using “Highly Endogamous”) and noticed that the parameters were set higher to numbers that are very familiar to me.

Leah Larkin (The DNA Geek) has shown in her presentations charts of various endogamous populations and to what degree of endogamy each has to deal with.  This is where I first saw how she utilized the average size segment to quantify endogamy, how to gauge how much endogamy you are really dealing with.

She took the amount of shared DNA for Close Relatives (Ancestry), predicted First Cousins, Second Cousins, Third Cousins, Fourth Cousins and Distant Cousins, divided by the number of segments to come up with the average size segment.  What was presented were various sizes present in specific endogamous populations.  She had mild, moderate and strong endogamy.  These were average size segments present in specific (predicted) relationships, i.e. 1C, 2C, 3C, etc.

In her comparison, the one that had the smallest average size segment were Polynesians. She also separated to demonstrate what Western Polynesians had compared to Eastern Polynesians.  She has confirmed (although many of us probably noticed this already) how endogamous, or extremely (“Highly” is the term used for this AutoCluster Endogamous tool at GEDmatch) endogamous Polynesians are.  This could not be done without the help of others submitting their samples to Leah for analysis.  I was able to submit one Samoan and two Kanaka Maoli samples to her to utilize. And the results were worth it!

Having said all of that, do know that Polynesians should automatically select “Highly Endogamous.”  This seems to raise the Min average segment cM and other parameters.  This image below is an example of what it looks like when you do not select anything and keep it at the default “Not Endogamous.”

Even with “Not Endogamous” you can still adjust the settings to your liking.

So below are the settings that you would automatically see when selecting “Highly Endogamous.”

It is important to note, based on what I have seen others post with their own comparison and my 11 years of noticing the largest segment size among Polynesians and known relationships, that the Min largest segment cM selected for 30cM is a good minimum amount to use.  This is what you would expect around the 2nd Cousin level.

I have at Ancestry and MyHeritage (as do other relatives of mine) endogamous matches whose largest segment exceeds 30cM yet what helped distinguish it from a true close relative versus an endogamous one is how they still have a significantly high amount of segments.

Below is a table of all of my matches (Ancestry) and I have highlighted my known relatives.  The ones not highlighted are the endogamous matches.

You can clearly see how with my known (highlighted) 2C, 2C1R, and 3C1R relatives (Predited as Second Cousin) the number of segments aren’t always as high. The ones that are, they have little to no non-Polynesian lines, which means more Hawaiian branches that are coming up as matches to me.  But, the largest segment is coming from our most recent common ancestor.  Notice that for the New Zealand Maori and Kanaka Maoli matches the number of segments are really high.

For comparison, this (table below) is a cousin of mine.  Although I did not indicate the true close relatives, it should be obvious based on the high amount of segments plus the average segment size which ones are truly close relatives.

For the past 11 years, this is what I have been noticing. That it was not common to see DNA matches among Polynesians (mainly Kanaka Maoli and NZ Maori) whose largest segment size exceeded 20cM.  Utilizing the average size (taking the total shared cM divided by the number of segments), we see 7cM and 8cM to be the norm both in my cousin’s predicted First Cousin matches and my predicted Second Cousin matches.  It is pretty common even when looking at the 3rd Cousin, 4th Cousin, and Distant cousin matches.

So this is why we have the type of results you would see with autoclustering and why the need to be able to adjust these parameters in order to find the best matches (true close relatives) to be used in clustering.

So now we have an understanding of what to expect among Polynesian DNA matches as far as the average size segment, the number of segments (to help get the average size segment), and the largest segment size.  In my next blog entry, I will address the results of running this tool and how adjusting these may or may not be as useful.

One thing to note is that various companies will use the longest block (FTDNA), longest segment (Ancestry), and largest segment (MyHeritage & GEDmatch) for the same thing.  I may use these terms interchangeably, but for this particular GEDmatch tool, I’ll only refer to it as largest segment.


In-common-with, shared matches, and clusterings

There are a few tools out there that either these DNA testing companies will provide to help distinguish our matches from each other.  They are known as in-common-with (icw) or shared matches.  The idea is that a group of DNA matches on your match list who match each other indicates a common ancestor.  

Figuring out a paternal DNA match from a maternal match may or may not be as challenging for some, depending on how well of a tree you have.  It might be difficult to know if a DNA match is on your paternal grandfather vs. paternal grandmother’s side, or from a maternal grandfather vs. a maternal grandmother’s side.  Or even going back further, figuring out that a DNA match is on your maternal grandmother’s father’s or mother’s side, or that grandparent’s maternal grandfather vs. their maternal grandmother’s side.  That would also depend on how well your tree is built out, and the same would apply for your DNA matches.

This is where the shared matches or in-common-with features could help.  For Polynesians, because we match each other to some extent due to endogamy (just as other endogamous populations will experience this), it can be confusing, misleading and really not useful.

Clustering

Visually, there are a few tools to help make it easier for you to distinguish.  Clustering (auto-clustering) is another tool, something that MyHeritage offers or you could use a third-party site such as GeneticAffairs.com to visually show you groups of matches.

Here I show a few of my 1st cousins who have DNA tested, both on my father’s and mother’s side.

My paternal 1st cousins are represented in the green.  My maternal 1st cousins are in red.  Then there are my 2nd cousins on my maternal grandfather’s side represented by the orange.  Going further back on my grandfather’s side, specifically to his mother’s side I have two 2nd cousins once removed who have tested, they’re in blue.  Then on my grandfather’s paternal side, other distant cousins, they are in lavender.

A closer look at this shows how on my father’s side (green) my 1st cousins will match each other, defined by a line.  Since we are all 1st cousins to each other, cousin 1 will match cousins 2, 3, 4, 5, 6 & 7, plus me of course as these are my DNA matches.  Cousin 2 will match 1 (as already mentioned) plus 3, 4, 5, 6 & 7.  The same for 3, 4, and so forth.  

For my mother’s side, I started off with the color red, my grandparents’ grandchildren. We all match each other.  Then going to my 2nd cousins (orange), they come from two different sisters of my grandfather Joseph.  So they all match each other, plus match me and my 1st cousins.  Then going back further on Joseph’s mother’s side (blue), they match each other plus my 2nd cousins plus my 1st cousins as we are descended from my grandfather’s mother Elena’s ancestors. Then finally my grandfather Joseph’s father’s side (lavender).  So while those cousins will match my 2nd cousins and my 1st cousins, they will not match my grandfather Joseph’s mother’s side.  That is the basic concept of how this will visually work.

With endogamy, or with Polynesian matches, that same cluster would basically have all the dots connecting each other.  So imagine my grandfather’s father’s side (lavender) matching my grandfather’s mother’s side (blue).   See the grey lines connecting the two sides.


Example of every dot connecting to each other – what you would expect to see with endogamous matches.

In reality, that is what we will see because of how we all match each other.

Gephi

I finally took the time to try to use a network analysis software called Gephi to demonstrate what this interconnected group of DNA matches could look like.  Previously I used a website’s tools.  That website is RootsFinder.com, and used their Triangulation tool that produced nearly identical results as Gephi.  But for now, just demonstrating what Gephi has to offer.

This diagram consists of 196 nodes (dots) and 9,494 edges (lines).  To get that, I had to import a csv (spreadsheet) file, the icw file which has 9,494 lines of names into Gephi.

As I said earlier, while these clustering tools do not work due to the fact that we connect to each other and usually at a very high amount of shared DNA, I was able to extract some information from it.  I probably could have extracted and gathered all of this data manually but taking it directly from a spreadsheet is not as easy as it is just data that are organized by columns, rows, and/or categories.  This is why these tools are available in order to provide a more visual way of interpreting your matches.

What I did gather from this and thought was interesting was that the longest segment size showed 12cM for 24% of my matches.  I noticed this years ago that the size of the longest segment, largest segment, or longest block (depending on the DNA testing company) for many of these predicted 2nd – 3rd cousins would be between 12cM – 14cM.  Rarely would it go over 20cM.  In my previous blog entries, I mentioned the importance of the longest segment size in determining a true 2nd – 3rd cousin.

Looking at that same data, we see that only a single DNA match has the longest segment size of 64cM.  That DNA match is actually my 2C2R (2nd cousin twice removed). 

This next image is the same data except now it’s showing the number of shared segments.  Prior to  Ancestry providing us the longest segment size, we only had to go by the amount of total shared DNA and the number of segments.  So the top (28% of my matches) shows 28 segments.  They seem to range between 25 – 29 for the most part.

An important thing to notice about this particular data, unlike other people who could actually produce nice clusters, is that when I ran this icw file that took about 4hrs to do, I had to limit the amount of shared cM (centimorgans).  This particular diagram in which the icw file I finished running last night range from 185cM – 199cM.  Yet I had 98 matches that fell into that range.

Prior to this particular icw file, I ran one back in May 2022 where I went as low as 90cM.  So it is 90cM – 190cM.  This was the result of that older icw file.

Looking at the data, 13 segments seems to be at the top making up about 14% of these matches.  That particular file had 1,215 matches, which the icw file produced 2,049 nodes and 1,046,502 edges.  That is a lot of dots and lines.

A few people had suggested using Gephi as I could tweak the data. I have been tweaking it for about a week, and as I knew I would not be able to get anything unique from it.  

The problem with this, something that any endogamous group would encounter is running the icw file.  Imagine having only 10 DNA matches.  But for an endogamous person where you could match nearly all the other people even if you are not really closely related at all, that could be easily multiplied.  So match #1 would match all of the other 9 matches on that list.  Match #2 would have about the same matching all 9 other matches on that list.  And the same for match #3, match #4, etc.  So that icw file gets larger and larger.  Now complicate that issue as the less amount of DNA you share, you probably match more people or have a longer list of icw people to add.  This is why I initially ran it again since last May but going down only as low as 185cM from 199cM rather than 90cM – 190cM.  As I go lower, the number of matches, the number of nodes and edges will greatly increase.

For non-endogamous populations, expect to see something that would be more clear.  Utilizing Gephi you could easily attach names and whatever data you would like to the nodes and distinguish each cluster from each other easily.

Auto-Cluster

As I mentioned MyHeritage as one of the DNA testing sites that offers auto-clustering with your DNA  matches.  If you have tested at MyHeritage, you could run an auto-cluster as often as you would like.  Unlike GeneticAffairs.com where you could adjust the parameters, MyHeritage seems to do it automatically.  So depending on the number of matches that you have, or in my case could have a lot of icw, they (automatically) decide what would be best to produce a decent amount of matches.

First, an example of what you would see with autoclusters:

What are autoclusters

Image from MyHeritage’s FAQ page.

What you would get are colored blocks assigned randomly.  The grey square are DNA matches who happen to match someone in one cluster as well as in another cluster.  This could indicate that you have a DNA match who might not have enough shared DNA to match everyone in a particular cluster, something that you would see in a more distant relative like a 2nd cousin of yours not matching a lot of your common 3rd cousins. 

That is basically how clusters work.  They are to help you figure out how your DNA matches match each other.  Then of course it is up to you to figure out based on their trees how all of you connect.

This autocluster of mine I generated back in June.

I actually now have two clusters.  MyHeritage puts a limit as how the maximum amount of shared DNA to be used in autoclusters.  400cM, since that is about the level what you would share with 2nd cousins, not with 1st cousins, maybe a few 1C1R (1st cousins once removed).  My second cluster which reflects my paternal (Filipino) side actually does consist of two 1C1R, a 1/2 1C and a 2C (2nd cousin).  One of those 1C1R in my second cluster is also Kanaka Maoli like myself, so that cousin did produce a few grey squares with some of my other DNA matches in that larger cluster.

What I also did was extract the data which I put on the right-hand side.  I sorted it by the least amount of shared DNA and identified the person if I knew their ancestry. You can also see the size of the largest segment and the number of segments.

A reminder that with MyHeritage’s autoclusters they implement a maximum threshold of 400cM.  The minimum threshold will vary depending on the person’s DNA matches, how much they share with you as well as how much they share with each other.

In my case, there were 494 matches taken from my list who share less than 400cM with me but more than 95cM (actually 108.1cM was the lowest amount shared).   They also decided that in order to be considered a shared DNA match, my matches need to match at least 95cM with each other.

Conclusion

While these tools are great for separating your DNA matches and possibly help you figure out how each one is connected to you and to each other, Polynesians will not benefit from these at all.  They actually could be misleading if they one does not understand what they are looking at, which is a lot of closely predicted 2nd, 3rd and 4th cousin matches.

Ancestry is finally showing Longest Segment size

I have been waiting and have asked Ancestry for this a few years ago.  Apparently, I was not the only person of an endogamous background who had asked for it.

I went through my list looking for the first known Maori, just to see how large the longest segment would be.  I have always advised Polynesians to look for anything at least 30cM for the largest segment (longest block at FTDNA) or as Ancestry is calling it, longest segment size in order to determine a true 2nd to 3rd cousin relationship.  I know with other endogamous groups they tend to look for something around 20cM.

At Ancestry, you will have to click on that match’s name in order to see the longest segment size.

Notice how the longest segment size is below 20cM, but based on the total amount shared the predicted relationship is anywhere between a 2nd – 3rd Cousin.  To show you what that looks like against known 2nd to 3rd cousin relationships, I am showing my match list about where the endogamous matches come in.  I indicate the Hawaiian ones versus the Maori ones and my known cousins.  I am inserting the longest segment size since you cannot initially see it on your list until you click on the match.

While I have a lot of 3rd cousin matches, my mother and one of my cousins have a lot of 2nd cousin matches.  My cousin had over 500 of 1st – 2nd Cousin predicted relationships.   Just looking at her top matches, I indicated the known relationships versus any Maoris and Hawaiian that she matches.

This definitely will help with determining the endogamous matches.  But the longest segment size does get smaller the more distant of the relationship becomes.  So by the 3rd to 4th cousin level, you may not really be able to tell, with the exception of the fact that we tend to get a lot more segments.

I have a 2nd cousin of whom we do not share a lot of DNA.  While we still share in the range of what is expected for a second cousin, the longest segment size is just over 20cM.


At least sorting through these matches have become easier now that we have this additional feature.  Again, this works well with the closer predicted relationships.  This may not be as useful if you already have a lot of distant matches and your Polynesian matches fall within that range.  A lot of my western Polynesian (Samoans and Tongans for example) matches are in that range.

Below are some of my Samoan matches and while their total shared is not a whole lot, their longest segment size is significantly smaller compared to what we normally see with eastern Polynesians.  This is true with other DNA companies like FTDNA and 23andme.

My top FTDNA matches where the endogamous matches come in among my known relationships.

I am hoping that in the near future Ancestry will put the longest segment size immediately on the match list page so it will be easier to go through rather than click on each name to see if the match really is worth looking into.    For now, what we have is definitely an asset to help us sort through these matches.

myOrigins 2.0 update – FTDNA

Back in April, FamilyTreeDNA (FTDNA) finally updated their myOrigins.  This was initially set to roll out shortly after November 2015’s 11th Annual International Conference on Genetic Genealogy held in Houston, Texas.

FTDNA started off with Population Finder, which was replaced by myOrigins in May of 2014.  With Population Finder, they had an Oceania (Papuan, Melanesian) category.  When they switched to myOrigins, they removed the Oceania category.  Since Polynesians are about 75% Southeast Asian and 25% Melanesian (Oceania), Polynesians would show up as just Southeast Asian.

They increased their population clusters so now they have a total of 24.  I believe prior to this newer version there were about 18 of them.  While a lot of people have reported how “off” these results are, focusing on just the Polynesian genome, I notice that there is a consistency to have about 3% – 9% Northeast Asian along with the predominantly nearly 75% Southeast Asian.

Population Finder, myOrigins 1.0 and myOrigins 2.0

These are the different versions.  FTDNA seems to be ever increasing the amount of European that I have for whatever reason.  I usually range between 8% – 12% at various DNA companies.

Below is a breakdown of what other Polynesians have been getting with the new version of myOrigins.


Click for full image

Percentage breakdown by the various East Asian and Oceanian categories.

For now it seems that the new version of myOrigins are giving a lot of people many trace regions.  While I did not include them in the image above, I have been seeing this for eastern Polynesians so far.  Maybe in the future there will be an update that could refine these trace regions so that it appears less for everyone.

New 5th Cousin connection helps map out chromosome!

HOW WE CONNECT

Now that I had figured out who my mother’s biological parents were it has become easier to find connections.  (You can read about it here: https://hawaiiandna.wordpress.com/2015/08/01/finding-a-dna-connection-despite-endogamy/)

While there is one branch where I find a lot of relatives on my great-grandmother Rose Holbron’s side, I am slowly finding distant connections on my great-grandfather Frank Kanae’s side.  Frank Kanae was Rose Holbron’s husband.

Earlier this week I received an email from a woman named Raychelle who saw me and my numerous kits of family members that I manage on GEDmatch.com as a match to her.  I began the normal response, almost ready to dismiss her since many of these matches appear to be close when in reality we are usually distant, and for others, much more distant.  And from what I could see, it wasn’t such a huge amount.  At GEDmatch, Raychelle and my mother shares 62.9cM total, with a large segment of 10.7cM.  So at least a 4th cousin level.

After I told her that she could find me on Ancestry (since she uploaded to GEDmatch via Ancestry) and look at my HOLBRON family tree, she found out that we have the LEWIS connection.

She is a 5th cousin to my mother, and a 5th cousin once removed (5C1R) to me.  I come from Isaac Lewis who was known as Isaac Lewis Kanae or Isaac Kanae Lewis, and also known by the Hawaiianized version – Aikake Lui.  While Raychelle comes from John George Lewis, and his Hawaiianized name was Keo Lui.  My assumption is that Keo was short for Keoki (George).  Keo could also be short for Keoni (John) and then there was the catholic version – Ioane for John.

But what was interesting is that she had this genealogy and I had updated mine from this to reflect what a couple of people have been researching.

According to the information that has been circulating at various sites on the internet, Isaac’s father – Captain Isaiah Lewis was the son of Captain Ezra Lewis.  And John G. Lewis was the son of Captain John Lewis, who was Captain Ezra Lewis’ son but through a different wife.  I listed them as spouse #1 and spouse #2 because different sites and people will switch the spouses showing Isaac as the son of one spouse, and another will show Isaac as the son of the other spouse, and vice versa for John G. Lewis.

Click to see larger image
So the question is, were Isaac and John full brothers, or (maternal) half-brothers?  And if they were (maternal) half-brothers, were their fathers paternal half-brothers?

While all of this information going back that far is based solely on people creating these trees without further documentation, for now I am only going by what was documented.  The trees habitually say that Polly was known as Sarah Pauline “Polly” Holmes.  While I can understand that Polly could be a diminutive for Paula and Mary, I’m not so sure that these are the same person, especially since a lot of the information lists this Sarah Pauline “Polly” Holmes having been born in Massachusetts and died there,  and that her husband Captain Isaac Lewis from Massachusetts too.

What we know for a fact according to testimonies from people who lived during the time of Polly Holmes and her father Oliver Holmes.

screen-shot-2016-12-02-at-12-32-31-pm

I am still in the process of confirming and documenting all of these ancestors, so for now I am considering Raychelle and I 5C1R, and that her 3x great-grandfather John George Lewis (Keo Lui) and my 4x great-grandfather Isaac Lewis Kanae (Aikake Lui) were full-brothers.


SHARED DNA SEGMENTS & CHROMOSOME MAPPING

I compared Raychelle to all of the relatives to see which segments we all had in common.  Any common segments or segments that multiple relatives share would indicate that segment was inherited from a common ancestor.  In this case, Polly Holmes and her husband Isaiah Lewis.

And while autosomal DNA inherited from our common ancestor can remain in our genome for about 5 – 6 generations, there are some cases where it can span several generations and for some as we have seen, in larger segments. These larger segments tend to be passed on within generations entirely intact and having not recombined.

With endogamy, that may confuse things as it isn’t guaranteed that the shared segment came from that same common ancestor.  Especially for Polynesians where we share many small segments.  And these multiple segments may not be in common with other relatives, or rather these segments may not overlap as what I am about to demonstrate.  So when looking to map out these segments, and at the 4x great-grandparent level, if the segments are really small, that may be suspect to being segments randomly inherited.  It may or may not be from the common ancestor, or may come from the same common ancestor multiple times through their different descendants.

I first compared my brother Kaimi and Raychelle and looked for the chromosomes that should match my mom.  Kaimi and I have different fathers, so I decided to use his to compare because his father is also Hawaiian.

I use Kaimi’s unphased and phased data to be sure that if there are extra segments that does not match our mother, then the presumption is that the segment came from Kaimi’s father.  These were the results.

screen-shot-2016-12-23-at-2-08-35-pm

You can easily see how with the phased data the size of the segment is somewhat smaller if it doesn’t remain the same or disappear altogether.

The real work comes in when I compare Raychelle to my mom’s brother’s son Chris, her half-brother’s daughter Lena and her maternal half-sister Aunty Stella.  The detailed specification of their relationship is to help you understand how they are related and know what is to be expected as far as sharing DNA with different relationships go.

What I did first was compare Raychelle to all of those family members mentioned and then see which of those matching segments actually matches up with what my mother matches.  Here’s a diagram of how we are related and descend from Isaiah Lewis and Polly Holmes.

screen-shot-2016-12-03-at-6-55-03-pm

I’ll start first with Chris, the son of my mother’s brother Joseph.

screen-shot-2016-12-04-at-7-33-00-am

While there were other segments that Raychelle shared with Chris, I am only comparing overlapping segments that are shared with my mom.  There are 3 chromosomes where they share overlapping segments.  Ch 6, 7 and 20.

With Aunty Stella, there were segments on different chromosomes, sometimes on the same chromosome but in different parts of the chromosome that did not overlap.

screen-shot-2016-12-04-at-7-45-56-am

Only one overlapping segment which is on ch 7.

Then with Lena, the daughter of my mom’s half-brother George.

Lena also shared different segments and different chromosomes with Raychelle that my mom does not have, except for ch 7.

So what is consistent with all of them is that a segment on chromosome 7 is shared with Raychelle.

The diagram above  shows how everyone matches each other, with the last one again showing my mom with Raychelle and that consistent block of segment.

So the fact that we all shared an overlapping segment in common with each other indicates that particular segment was inherited from our common ancestor.  In this case, both Isaiah LEWIS and Polly HOLMES.  But how do we figure out if that segment came from Isaiah vs. Polly?  Remember that there was a discrepancy that Polly’s two husbands – Isaiah LEWIS and John LEWIS were paternal half-brothers according to some other genealogy and that Isaac LEWIS KANAE was Isaiah’s son, while John George LEWIS was John LEWIS’ son.  Both Isaac and John had the same mother – Polly HOLMES.

The best way to distinguish that inherited segment being inherited from Isaiah LEWIS or Polly HOLMES is to test members of each of those families.  That would be distant relatives of whom we cannot find a connection to just yet.  Instead, I used another method.

Since my mother tested at 23andme, they have the ability to show the ancestry broken down by each chromosome. This is what my mother’s 7th chromosome looks like.


screen-shot-2016-12-03-at-7-36-33-pm

23andme identifies portions of the Hawaiian segments of the chromosome as a combination of East Asian & Native American, and Oceanian.  I simplified it by just indicating Hawaiian.  Both of my mother’s parents were Hawaiian, but her mother Rose KANAE also had European ancestry.  Which is why in that diagram one chromosome is labeled as the paternal chromosome, the other as the maternal.

My mother’s maternal grandmother was Rose HOLBRON.  Rose’s paternal grandfather John HALBORN was from Hull, England, and her maternal grandfather William LUDLUM was an American whaler from Jamaica, Queens, New York.  Rose HOLBRON’s grandmothers were Hawaiian (Kanaka).

But it is Rose KANAE’S father – Frank KANAE whose paternal grandmother Mary LEWIS KANAE’s father was Isaac LEWIS KANAE.  Isaac’s father was Captain Isaiah LEWIS.  Isaac’s mother Polly HOLMES was the daughter of Oliver Holmes of Kingston, Plymouth, Massachusetts and Mahi, daughter of the chief Kalanihooulumokuikekai of Ko’olau.  My assumption was that the European portion from Rose KANAE’s father is too far back.  In other words, the European portion of that chromosome that my mother inherited from her mother could have only come from John HALBORN or William LUDLUM, or a combination of both.

There are a few factors that could make a segment remain in tact for several generations:
1) The length of the chromosome.
2) How many cross-over events there were for that particular chromosome.
3) Location on the chromosome (some areas are more SNP dense than others).
4) The possibility of having fewer cross-over events or none at all (we see this happening as well).
This segment seems to match nicely ranging from 7.1cM (my mom) to 9.1cM (Aunty Stella) with all the relatives.

So when I visually compare the section of chromosome 7 that matches up with the shared overlapping segment for all of us, this is where they line up.


If you have read my other posts, you would have read that multiple segments for Polynesians can remain for awhile given that we come from a few common ancestors multiple times.  This paritcular segment had to have come via Polly HOLMES’ mother – Mahi who got it from her parents Kalanihooulumokuikekai and his wife.  And since Raychelle is also a descendant of Polly HOLMES and Isaiah LEWIS, this portion of chromosome 7 did not come from my HOLBRON side.

While my family members used for comparison descend from Isaac LEWIS KANAE’s daughter Mary LEWIS KANAE, there are other descendants through Mary’s sister Papanaha LEWIS KANAE who got DNA tested.  But only one of them was a match to Raychelle.

screen-shot-2016-12-04-at-4-00-56-pm

This cousin shares an overlapping segment of 8cM on chromosome #7.  But when I compared that relative to my mother, they did not share that particular overlapping segment, although all my other close relatives did share that overlapping segment with this cousin.  After looking into it further, I found out that my mother seemed to have inherited a smaller section of that overlapping segment compared to other family members, and her matching criteria just did not qualify as a match according to GEDmatch.com where all of this analysis was done.  After all, she shares the least out of all the relatives only 7.1cM of this segment and Aunty Stella shares 9.1cM.  And while she gave me and my brother Kaimi this segment, my brother Travis did not inherit this segment.  Which means this portion of chromosome 7 for him was from our grandfather, not our grandmother Rose KANAE.

But that is what is complicated about mapping out segments for Polynesians. These segments could be from any of these lines going back to the same common ancestor multiple times. That means that Raychelle could just so happen match all of us via my maternal grandmother Rose KANAE’s mother’s side, or my great-grandfather Frank KANAE’s mother’s side, or John KANAE’s father’s side, and so forth.  It could also be just by chance, that we share the segment with any other of her Hawaiian ancestors.

Since many Polynesians share multiple small segments and as small as 7cM, as well as having these segments line up very close to each other if not right next to each other, it makes chromosome mapping very difficult to do.  For example, I mentioned one of Papanaha LEWIS KANAE’s descendants share that same overlapping segment on chromosome 7 with the rest of us, while the other descendants  share multiple non-overlapping segments.  I cannot easily assign them to our common ancestor – Isaac LEWIS KANAE, or presume that all of these multiple segments came from our common ancestor.

Since Polly HOLMES is 6 generations away from my mom and all of her descendants share this same overlapping segment, it is safe to presume that this segment came from Polly HOLMES’ mother – Mahi.  And now I can assign at least this small portion to Mahi.

screen-shot-2016-12-04-at-4-11-13-pm

Determining half-relationships with Polynesians – Part II

In my last entry I demonstrated the difficulties of determining the half-relationships after receiving the DNA results of my half-first cousin.   Within an endogamous group, that could be even more difficult as we see larger amounts of DNA shared.

While the ISOGG Wiki Autosomal DNA Statistic page can list the average amount of centimorgans shared,  Blaine Bettinger’s The Shared cM Project  demonstrated that the minimum and maximum amounts shared can vary.  This becomes more evident as the distance of relationship increases.

Within an endogamous group it makes sense that having more than one pair of common ancestors may increase that amount.  The same would apply if you descend from the same common ancestor multiple times.  Both would produce higher amounts shared.

A few months ago I got the results of my aunt believed to be a full-sister of my mother.  My aunt suspected that her father was not her biological father.  And she was right.  But she was not the only one who knew of this, but the rest of the family, particularly the ones of my generations believed that this Aunt’s father was her biological father and did not suspect otherwise.

From my mother’s Family Finder (autosomal) match list at FTDNA:

Screen Shot 2016-05-03 at 5.21.34 PM

The top is my mother’s sister while the one right below it belongs to my half-1st cousin whose father George was mentioned in the last entry – Determining half-relationships with Polynesians.

Initially I was confused by the total amount since I knew it was more than what I shared with two of my half-brothers.  This is how two of my half-brothers compare to me and to each other.

Screen Shot 2016-05-03 at 5.47.08 PM

So my mother and her sister did share a bit on the high-end for half-siblings, but low end for full-siblings.  These are the predicted averages shared for siblings vs. half-siblings.

Screen Shot 2016-05-03 at 5.52.23 PM

The next step was to take a look at the X chromosome.  For half-sisters who had the same father, they would share an entire X chromosome based on how the X is inherited.  To my surprise, it looked like someone took a razor blade and sliced out some pieces of the image.


5+cM setting

5+cM setting


1+cM

1+cM

For half-sisters they share a lot compared to what I saw when comparing my half-brothers to each and to me.  Also, I decided to include both the default 5+cM setting and the 1+cM.  With my brothers, we hardly get anything when I lower it to 1+cM.  But with my mother and aunt, you can see a difference although chromosomes 4 and 18 are more likely to be IBS, but given the situation (endogamy, small communities, & isolation) it just may be IBD from a very long time ago.

So the X was not helping me one bit since I thought maybe they were areas on the chromosome that could not be read – no calls.

I immediately uploaded to GEDmatch for further analysis.  No surprise that when I looked at the X, it was the same exact thing.   Knowing that it wouldn’t be helpful, I turned to the other 22 pairs of chromosomes.

Screen Shot 2016-05-03 at 6.52.44 PM

What you would be looking for in full-siblings are full-identical regions (FIR) which are the green sections on the bar graph.  Here is an example of my 1st cousins, a brother and sister.

Screen Shot 2016-05-03 at 7.55.59 PMScreen Shot 2016-05-03 at 7.56.08 PM

About 25% will be fully identical.  You can read more about how much full versus half-identical regions siblings would share at ISOGG’s Wiki – Fully Identical Region page.

This is what my mother and aunt showed.

Screen Shot 2016-05-03 at 11.18.11 PMScreen Shot 2016-05-03 at 11.18.36 PM

There are only small chunks of  FIR rather than long segments of it that you would see in full-siblings.  So this confirms a half-sibling relationship.

Determining half-relationships with Polynesians

I recently got my cousin’s results to compare to my mother and my brothers.  This cousin’s father was my mother’s half-brother George, so a half-first cousin relationship.

Prior to making contact with my mother’s relatives I was thinking of having these cousins tested as a means to figure out who my mother’s biological father really was.  But a couple of months ago when I did make contact with these long lost relatives it was revealed that my mother’s biological father was Joseph Kaapuiki Akana, the man whom I doubted was my mother’s father based on his name (Akana is of Chinese origin) and the fact that my mother remembers her father being pure Hawaiian and her DNA composition does not support Chinese ancestry.  I thought that maybe testing these half-cousins would determine if their grandfather was my mother’s biological father.  But it is more complicated than I realized.

Like my mother’s father Joseph Kaapuiki Akana, George’s father was also Hawaiian.  George and my mother shared the same Hawaiian mother.

This is what the ISOGG Wiki Autosomal DNA Statistics page says about how much should be shared between a half-aunt and also to half-cousins.

Screen Shot 2015-12-29 at 7.17.17 PM

Combining with Blaine Bettinger’s Shared cM Project, the total shared for a half-aunt would range from 540cM to 1348cM, averaging 892cM.  The average is around the amount indicated by the ISOGG Wiki page.

For a half-first cousin, Blaine Bettinger’s Shared cM Project says it would range from 262cM to 1194cM, averaging 458cM.  Again, that average is what is indicated on the ISOGG Wiki page.

This is how GEDmatch.com compares my half-cousin to us.

Screen Shot 2015-12-29 at 7.33.09 PMIt is obviously on the high end, for a half-aunt while half-first cousin, not that extreme.  But we are talking of one example only.  There are more half-cousins that I could have test and probably will in the future.  And all of these cousins have had a grandfather that was Hawaiian, so I would expect their amounts to be high.

Comparing to non-endogamous groups, I compare my paternal aunt to her nephews and nieces and a great-nephew and great-niece on GEDmatch.

Screen Shot 2015-12-29 at 7.45.46 PM

My cousin Terri may share the lowest total among the 1st cousins but it does not seem that significantly different from the average 1700cM.  It is interesting to see that her largest segment is 104.7cM.  When I look at my half-first cousin and how much she shares with her half-aunt (my mother), the total is 1412.8cM, and largest segment is 103.3cM.  That figure can be misleading.  I have more cousins on my father’s side that I have yet to test and there may be other cousins who share less or more with our aunt than the cousins that have already tested.

If I take my aunt out of the equation, this is how the cousins compare to each other.

Screen Shot 2015-12-29 at 7.50.04 PM

A couple of my paternal 1st cousins share much less with each other than my half-cousin does with me and my brothers.

It will be awhile before I can get an ample amount of Polynesians who have close relatives tested to fully make a comparison.  Initially I wanted to see if testing half-cousins would help determine if my mother’s siblings were half or full siblings and when I was not certain that Joseph Kaapuiki Akana was her biological father.

It is clear now that any type of half-relationship is difficult to determine if the other parent is also Polynesian, and in our case Hawaiian.  My grandmother married 3 different Hawaiian men and so far from what I know, they have ties to geographically different places.

The endogamous nature just makes it hard to determine the relationship even if it is a close relationship.  It does not have to be a distant 3rd cousin and beyond to appear as a closer relationship.  Even with cousins (half or full) and half-siblings, they seem to appear on the higher end of the relationship, possibly giving a false prediction if the true relationship was not known.

Recent Founder’s Effect, bottlenecking and 6 Tahitian women on Pitcairn island

I finally got the autosomal results of a Pitcairn resident who has been a member of the Polynesian project for a year now.  Previously I had another member who is a Norfolk island descendant and whose ancestors moved to Norfolk but were originally from Pitcairn.  Another Norfolk descendant tested at another company, but his raw data were uploaded to GEDmatch.com in order to be compared.  Now having that this particular Pitcairn resident tested, I can make a comparison for these 3 people since they all have ties to Pitcairn.


HISTORY OF PITCAIRN ISLAND

Pitcairn was settled in 1790 by mutineers of the HMS Bounty and Tahitians1.  The initial population of 27 consisted of 9 mutineers, 6 Tahitian men and 11 Tahitian women along with an infant girl.  Only 6 of the mutineers and 6 Tahitian women would produce descendants.

Mutineers:
1) Fletcher Christian
2) Edward Ned Young
3) John Mills
4) William McCoy
5) Matthew Quintal
6) John Adams

Tahitian women:
1) Mauatua Maimiti
2) Teraura
3) Teio
4) Tevarua2
5) Vahineatua
6) Toofaiti


POPULATION GROWTH, DECREASE & RE-POPULATION

The population started with 27 people but only 12 of them would produce descendants.  By 1840 the population exceeded 100, and by the mid-1850s the community was outgrowing the island3.

On May 3, 1850 the entire community left for a 5 week trip and settled on the island of Norfolk on June 8.  Nearly 3 years later 16 of them returned to Pitcairn.

Screen Shot 2015-12-21 at 9.03.27 AM


EFFECTS WITH AUTOSOMAL DNA

I have mentioned in previous blog entries that eastern Polynesians are genetically less diverse than western Polynesians.  So it should be no surprise that Hawaiians and Maoris as well as Tahitians will come up as closer matches to each other despite sharing common ancestors 8 centuries ago.

Now we are looking at two things.  Firstly, a founding population where only 12 people produced offspring, and half of the 12 being Tahitian women, or eastern Polynesians.  And these 12 were not paired off equally.

Screen Shot 2015-12-21 at 9.32.29 AM

They married multiple times, some of them never produced descendants with their other spouses.

Secondly, there was a population bottleneck in 1859.

Screen Shot 2015-12-21 at 9.35.35 AM

In 1856 the population expanded to 193, then the entire population left.  That population was already interrelated just 66 years after the initial 12 founding people started the population.  They all left, but 16 of them returned.  Eventually, a few more returned but the remaining population continued life on Norfolk island while the rest of the Pitcairns were starting the population again. It would take only 23 years to repopulate the island increasing the population to 250.


ANALYZING A PITCAIRN RESIDENT’S AUTOSOMAL DNA

The Pitcairn resident descends from all of the 12 founding people.  No surprise, given that small amount plus that was just 225 years ago and 7 generations ago for this particular person.

Although I cannot show with a family tree how many times they descend from the 12 founding people due to size and the complexity of the tree, I decided to list the number of times they descend from each of the 12.

Screen Shot 2015-12-21 at 9.50.22 AM

This resident’s paternal grandparents are 2nd cousins one way, and 3rd cousins another way while their maternal grandparents were 2nd cousins two ways.  There are more ways that they are related going further back as well, but my genealogy software cannot pick up the multiple relationships and it seems to select the closest relationship but selected 2nd cousin once removed, so not sure which line it was picking up.  This person’s maternal grandfather was born on Pitcairn but there is no known genealogy for him.  For their other grandparents, here is who they descend from.  (Founding people in bold)

Paternal grandfather – Christopher Warren, son of George Warren whose mother was Agnes Christian, and Alice Butler whose mother was Alice McCoy.
Paternal grandmother – Mary Christian, daughter of Sidney Christian & Ethel Young.
Maternal grandmother – Ivy Young, daughter of William Young & Mercy Young.

Agnes Christian and Alice McCoy were 2nd cousins, great-granddaughters of Fletcher Christian and Mauatua.  Ivy Young’s parents William and Mercy Young were 2nd cousins two ways to each other.  Great-grandchildren of Edward N. Young and Toofaiti and of Fletcher Christian and Mauatua.

As confusing as it seems, you can imagine how would DNA show up.  After uploading the raw data to GEDmatch.com for further analysis, I immediately ran the “Are Your Parents Related” tool.

Screen Shot 2015-12-21 at 10.07.52 AM

It predicted 3.3 for the most recent common ancestor (MRCA).  Still not sure how to interpret GEDmatch’s MRCA estimation, but in reality, the most recent common ancestor would be their 2nd great-grandparents – Thursday October Christian II and Mary Polly Young.  And there were other Youngs as I previously mentioned and Christians as well.

When I ran my mother’s kit through that same tool, her largest segment was 13.9cM, and there were a total of 5 segments that would total 51.5cM.

Largest segment = 13.9 cM
Total of segments > 7 cM = 51.5 cM
Estimated number of generations to MRCA = 4.1

Unlike the Pitcairn resident whose largest segment was 24.7cM and with 11 segments.  My mother’s parents were from different islands and as far back as I was able to trace their ancestries, they did not intersect nor did their ancestors come remotely near to each other given that they were from 3 different islands.

I would love to get more Pitcairn residents to test, to see if there is any noticeable pattern using this tool, or David Pike’s ROH.  If there is, we definitely could use it in helping to determine a true close genetic match versus an endogamous one.


COMPARING TO NORFOLK DESCENDANTS

There are 2 particular matches to many of the Polynesian DNA project’s members and both of these 2 people are descendants of Norfolk residents.  I will refer to them as Norfolk #1 and Norfolk #2.

Norfolk #1’s maternal grandmother was from Norfolk and she was the daughter of Francis Nobbs and Ruth Christian.  Norfolk #2’s maternal grandfather was from there, and his parents were William Adams and Sarah Christian.

A further breakdown where I bold the founding people.

NORFOLK #1
Francis Nobbs’ ancestry, son of Alfred Nobbs & Mary Christian:
Paternal grandfather – George Nobbs
Paternal grandmother – Sarah Christian, daughter of Charles Christian & Tevarua
Maternal grandfather – Benjamin Christian, son of John Buffett & Mary Christian
Maternal grandmother – Eliza Quintal, daughter of John Quintal & Maria Christian

Sarah and Maria Christian were daughters of Charles Christian & Tevarua, while Mary Christian was their 1st cousin.

Ruth Christian’s ancestry, daughter of Isaac Christian & Miriam Young:
Paternal grandfather – Charles Christian, son of Fletcher Christian & Mauatua
Paternal grandmother – Tevarua, daughter of Teio
Maternal grandfather – William Young, son of Edward N. Young & Toofaiti
Maternal grandmother – Elizabeth Mills, daughter of John Mills & Vahineatua

NORFOLK #2
William Adams’ ancestry, son of John Adams & Caroline Quintal:
Paternal grandfather – George Adams, son of John Adams & Teio
Paternal grandmother – Polly Young, daughter of Edward N. Young & Toofaiti
Maternal grandfather – Arthur Quintal, son of Matthew Quintal & Tevarua
Maternal grandmother – Catherine McCoy, daughter of William McCoy & Teio

When comparing the two Norfolk descendants to the Pitcairn resident, I was surprised to see no overlapping segments.

Screen Shot 2015-12-21 at 1.36.43 PM

Screen Shot 2015-12-22 at 12.58.16 PM

It is interesting to see how for Norfolk #1, the largest segment is 40.85cM for the largest segment and a total of 134.5cM.  The largest segment is significant, and although Pitcairn & Norfolk #1 are related multiple ways, the closest known relationship makes them 4th cousin once removed.

Comparing Pitcairn to Norfolk #2, the largest segment is 27.3cM, which for Polynesians in general could be pretty distant.  Total shared is 95.1cM.  And just as with Norfolk #1, Norfolk #2 and Pitcairn are related multiple ways, but the closest relationship makes them 4th cousins.

At the moment I cannot compare Norfolk #1 and Norfolk #2, but I am trying to get one that taken care of in order to upload Norfolk #1’s raw data to GEDmatch for further analysis.

I was expecting to see the overlap at least when comparing to the Pitcairn resident given that their ancestors’ have been on the island since the beginning, but it goes to show how unpredictable and random DNA can be.

A list of all 3 and how many times they each descend from the following founding population.

Screen Shot 2015-12-21 at 1.46.23 PM

And while various Polynesians can be compared to all three of these people and may show overlapping segments, there is really no way to map these segments.  These 3 testees would match other project members based on segments inherited by one or more of these 6 Tahitian women that settled on Pitcairn.  And we all would have shared common ancestor(s) from at least 8 centuries ago.

Below I compare the Pitcairn resident to a Hawaiian, a Maori and a Cook Island Maori as well as my Hawaiian mother.  Incidentally, there is a project member whose father was from Tahiti, yet that person does not come up as a match.

(default setting)

Screen Shot 2015-12-21 at 3.40.11 PM

(1+cM setting)

Screen Shot 2015-12-21 at 3.48.43 PM


Comparing Norfolk #1 with the same people with the exception of not being a match to the Cook Island Maori.

(default setting)

Screen Shot 2015-12-21 at 3.41.18 PM

(1+cM setting)

Screen Shot 2015-12-21 at 3.51.14 PM

Norfolk #2 did not test at FTDNA but at 23andme, and although their raw data was uploaded to GEDmatch.com, all the others being compared were not uploaded except for my mother’s raw data.

For additional information about the DNA study of the descendants of the Mutiny on the Bounty, see ‘Mutiny on the Bounty’: the genetic history of Norfolk Island reveals extreme gender-biased admixture.

Footnotes

1. History of the Pitcairn Islands.
2. Pitcairn Settlers lists an additional Tahitian woman known as Sully, as the wife of Matthew Quintal and the mother of Matthew Jr., John, Arthur, Sarah and Jane Quintal. Another source, as well as the Pitcairn resident who got DNA tested, claims that there were only 6 Tahitian women of whom they descend from.  There was no mention of Sully, although Tevarua is listed as being married to Matthew Quintal and the parents of  Matthew Jr., John, Arthur, Sarah, and Jane Quintal.
3. Historical Population of Pitcairn.

The randomness of autosomal DNA

Now that Ancestry is able to show how many centimorgans and number of segments are shown, I was comparing my top two closest matches.  They are listed as “lkauhi” and “Frank”.  They are under the 2nd cousin category predicted in the 2nd – 3rd cousin range.

Screen Shot 2015-12-02 at 1.55.19 PM

Prior to my mother getting DNA tested, I had no idea exactly how close they would really be.   Now that my mother got DNA tested and I figured out who my mother’s biological parents were, I was able to construct a diagram.  “lkauhi” is on my grandfather’s side while Frank is on my grandmother’s side.

How Frank & “lkauhi” are related to me.

My mother Judy is a 2nd cousin to “lkauhi”.  That makes me and “lkauhi” 2nd cousins once removed.  While Frank and I are 2nd cousins, because his mother and my mother are 1st cousins.

Here is how much Frank and I share and how much “lkauhi” and I share.

Screen Shot 2015-12-02 at 1.53.14 PM

Screen Shot 2015-11-26 at 10.00.35 PM

224 centimorgans is what “lkauhi” and I share

And although my mother shares 439cM with Frank while sharing 430cM with “lkauhi” (not shown in any diagram), the amount shared seems pretty high for a 2nd cousin.  However, we are talking about Hawaiians whose ancestors have gone through repeated founder’s effect which resulted in our high shared amounts.  She in return managed to pass unto me more of her father’s DNA so that when compared with “lkauhi” we end up sharing more compared to Frank who is in my generation and on my grandmother’s side of the family.  Unfortunately my grandparents are not alive to get them DNA tested for a true comparison.

Also, both of these people have not transferred over to GEDmatch so I am unable to get a better comparison.  This reminds me of what my cousins said about how much I look a lot like our uncle, and that both my mother and I really look like my grandfather Joseph Kaapuiki.  Maybe it is something genetic?  If my mother shared a lot with “lkauhi”, it could be because we inherited more from Elena Kauhi, my mother’s paternal grandmother.

The good thing about all of this is that it confirms that Joseph Akana fka Joseph Kaapuiki was my mother Judy’s biological father, since Joseph’s mother was Elena Kauhi.  And “lkauhi’s paternal grandfather Johnathan Kauhi was a brother to Elena Kauhi.

Both of these closest matches are from each of my maternal grandparents’ side.  Frank is from my grandmother Rose Kanae’s side while “lkauhi” is from my grandfather Joseph Kaapuiki’s mother Elena Kauhi’s side.

Some Runs of Homozygosity but no relation

Last year I blogged about GEDmatch’s “Are your parents related” where it looks for Runs of Homozygosity or identical alleles on paired chromosome that would indicate a possible close relative.

But now that I have found & confirmed my mother’s biological parents, I took a look again at GEDmatch’s “Are your parents related” tool to see their predicted genetic distance.

Are your parents related?
It estimated 4.1 generations to the MRCA (most recent common ancestor).  I normally do not go by GEDmatch’s predicted estimated number of generations but in this case because I cannot determine whether 51.5cM is a lot or not, and if 13.9cM largest segment plays a pivotal role or not, I am going by their estimated number of generations.

This is my mother’s genealogy.  I italicized all females.

Genealogy1) Mahi – Ko’olau, O’ahu
2) Kumahaulu – O’ahu
3) Kaapuiki – Kapa’ahu, Puna, Hawai’i
4) Piipii – Puna, Hawai’i
5) Naea – no information
6) Kamau – Hau’ula, O’ahu
7) Ehu – Mapulehu, Molokai
8) Kalahope -Pulama, Puna, Hawai’i
9) George – Kalapana, Puna, Hawai’i
10) Laahiwa – Kalapana, Puna, Hawai’i
11) Hookano – Honomuni, Molokai

These are my Kanaka or aboriginal Hawaiian ancestors.  The people I specifically chose were at the end of my genealogy branches.  I’ve listed their known origins with the names of the place (ahupua’a), district and/or island.  The main thing to look for is that both of my mother’s parents Joseph and Rose just do not have families coming from the same areas.

My grandfather Joseph’s family was from the island of Hawai’i.  Rose’s paternal grandfather John was from Molokai as well as his wife Hookano.  Ehu was also from Molokai while Kamau was from O’ahu.  It is not clear where John’s father Naea was actually from.

The point of all this is to show how contrary to predicted closeness with all of these DNA companies and even a tool to look for ROH, that there is still no known close connection to my grandparents.

Finding a DNA connection despite endogamy

MISLEADING CLOSE MATCHES

Shortly after getting my DNA results back in May 2013, I learned that majority of my DNA predicted connections are an endogamous connection.  That means a predicted connection that appears to be much closer than it really is.  Being Polynesian (Hawaiian), I am a result of generations of constant bottlenecking and founder’s effect that have occurred through the centuries.  This effect is much more pronounced among eastern Polynesians like Maoris and Hawaiians whose homeland were the last places in Polynesia to be settled.

Since my mother was adopted and both of her parents were Hawaiian, I knew it was going to be a bigger challenge.  Like other Polynesians, documentation for genealogical purpose was limited and it was not until 1860 when King Kamehameha IV passed an act to regulate names did surnames begin appearing for Hawaiians.  Even right after that, surnames appearing within families were inconsistent and it varied between families, generations (some starting it later than others) and also islands.

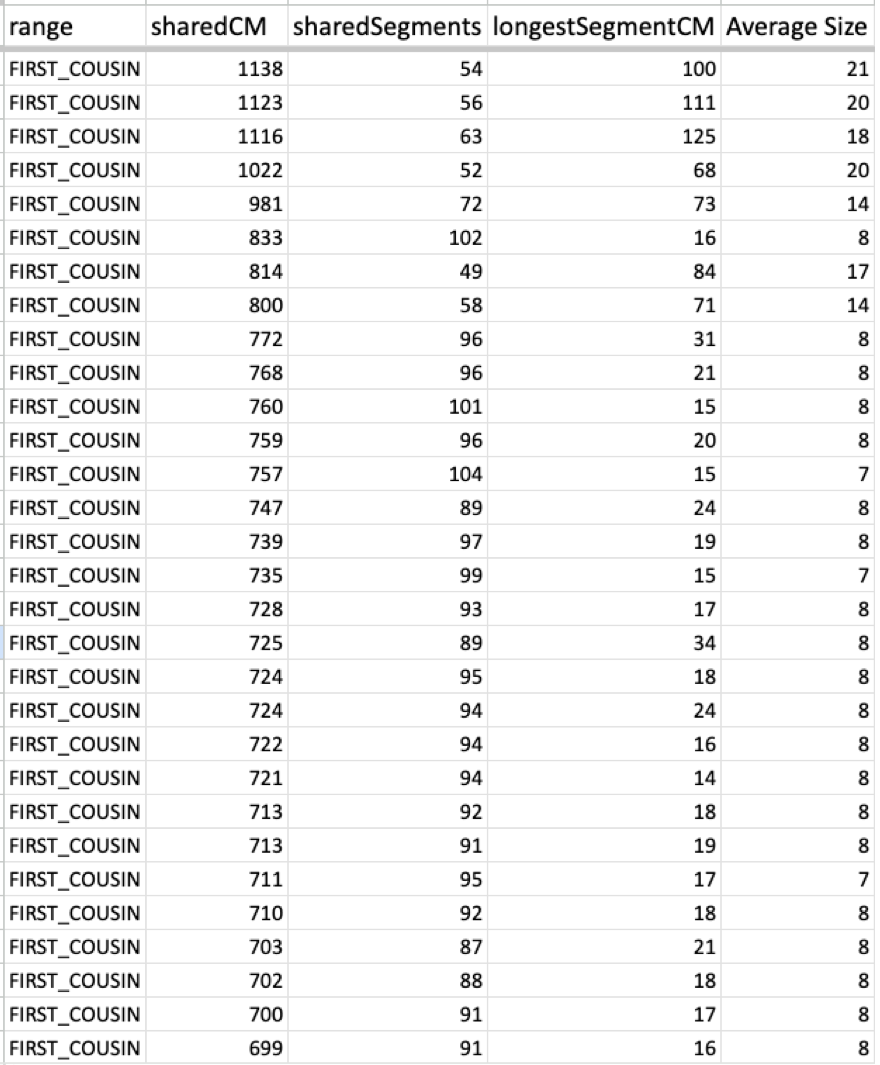
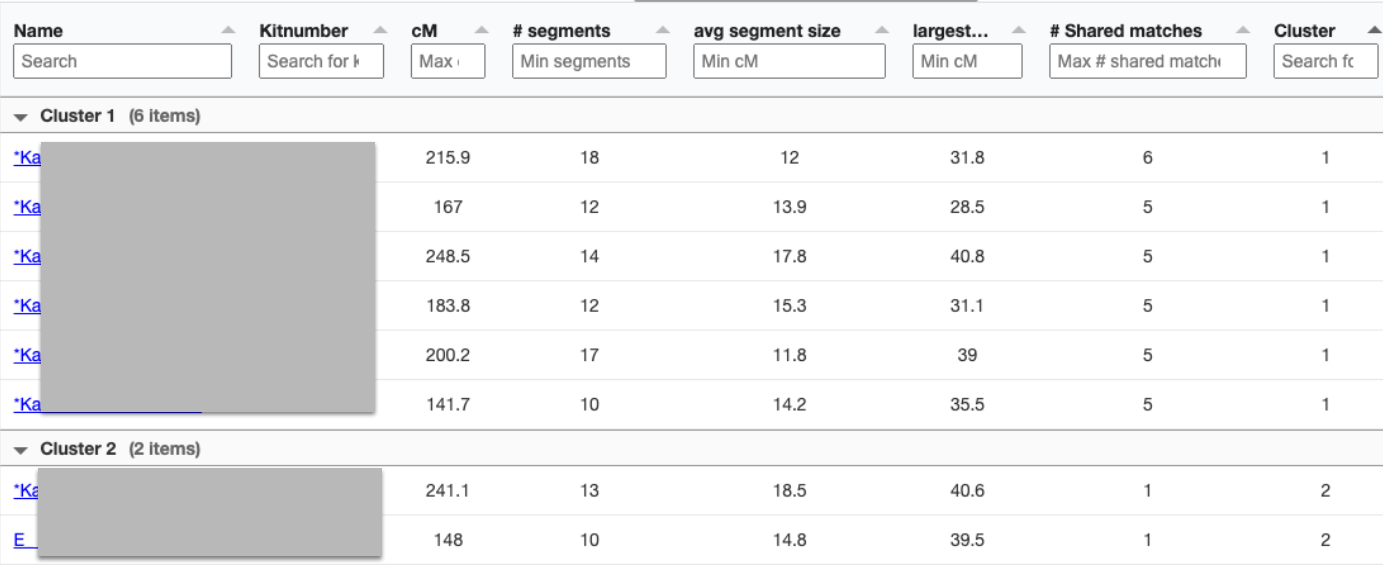
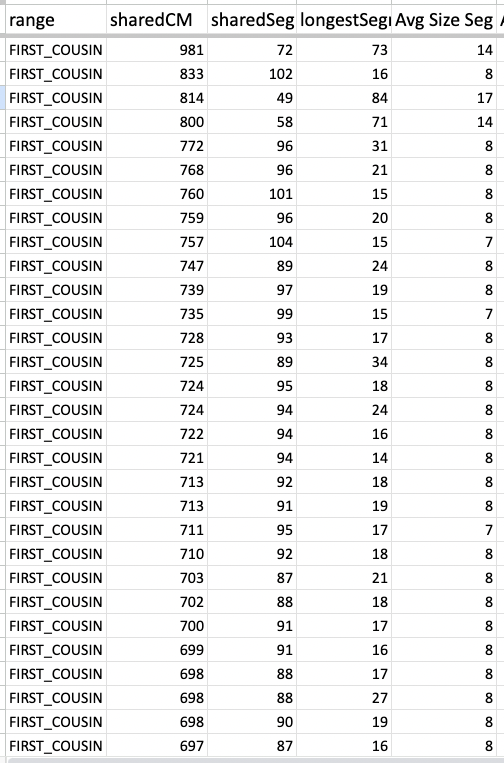
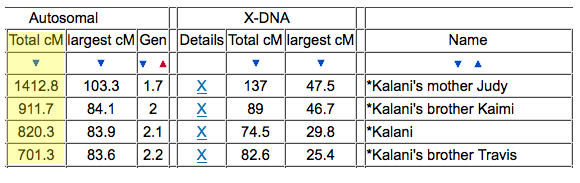
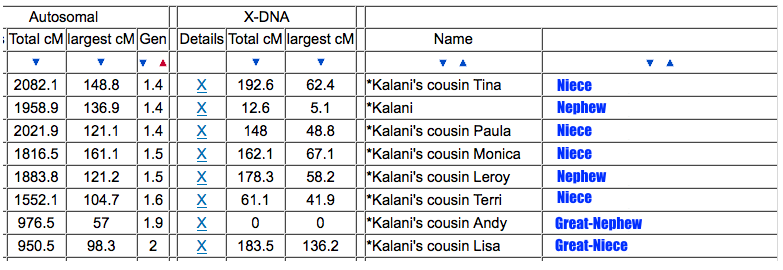
At FTDNA, my mother’s matches can have a total shared cM way above 300 (5 pages of those), while her longest block [largest segment] size tends to stay under 20cM.  These are the matches from her 1st page.

Screen Shot 2015-07-17 at 3.35.11 PM

FTDNA’s requirements for a match allows the tiniest segments to be included once the criteria of the longest block has been met.  But in an endogamous population, specifically Polynesians, they tend to report the number of segments to be well over a hundred.

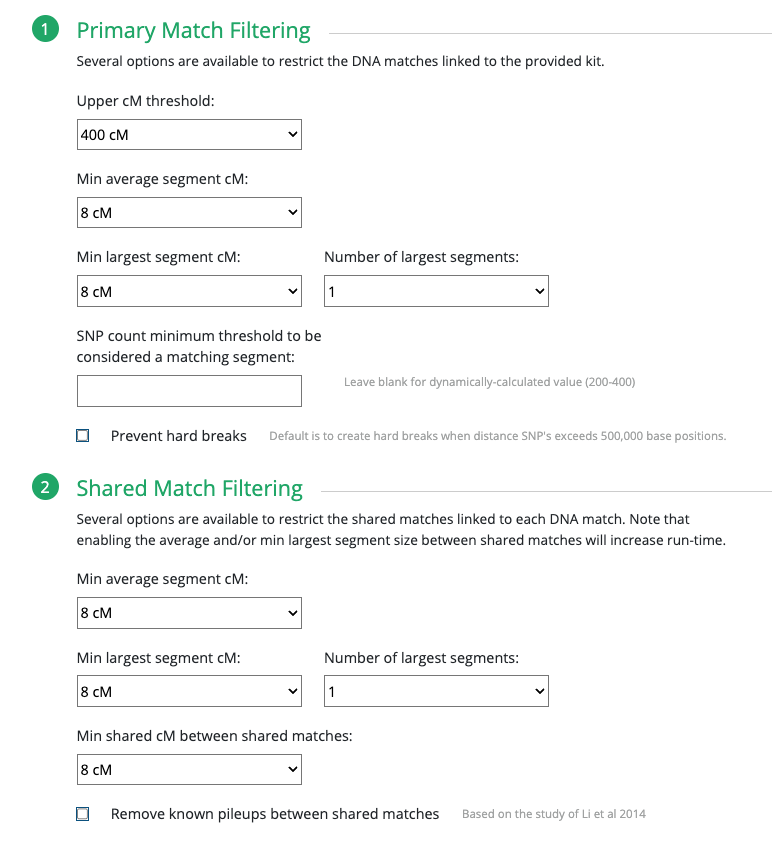
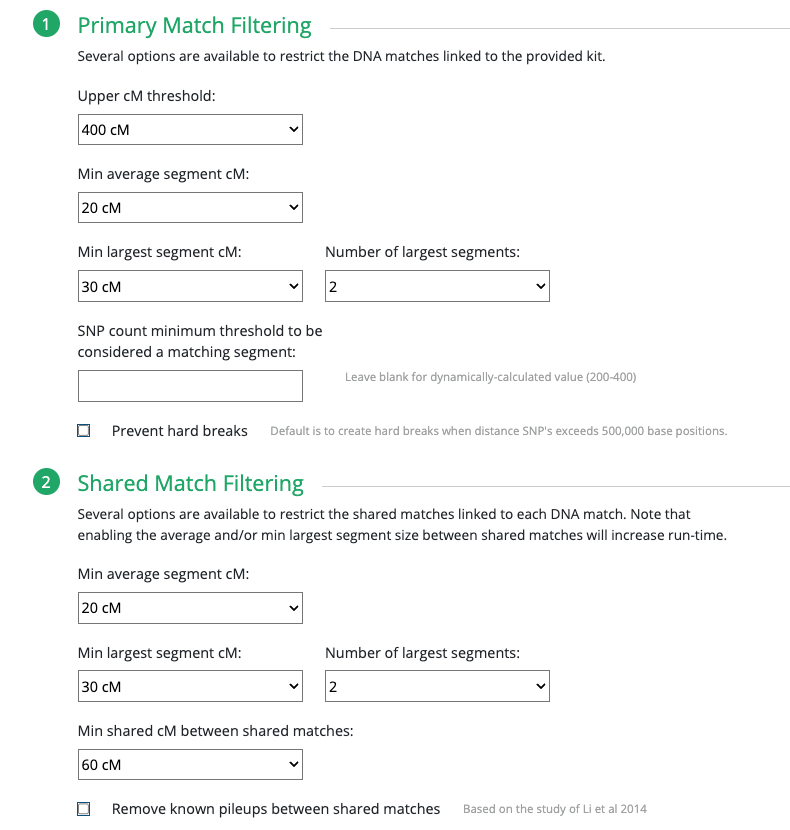
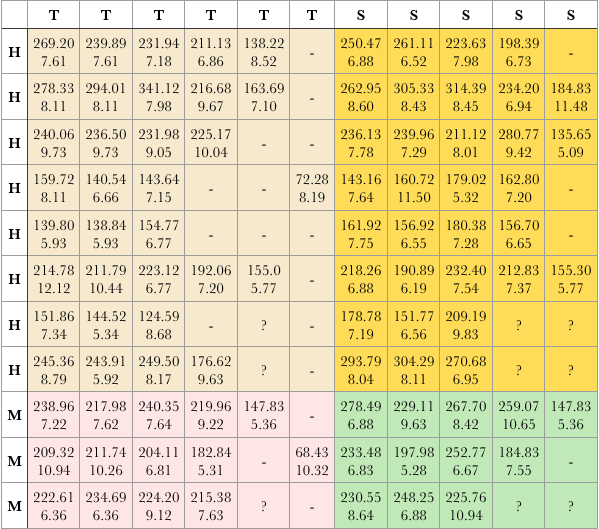
23andme is slightly different.  At the default, the matches are sorted by relationship which is shown on the left column, while on the right column is sorted by percentage.

Screen Shot 2015-07-17 at 3.44.40 PM

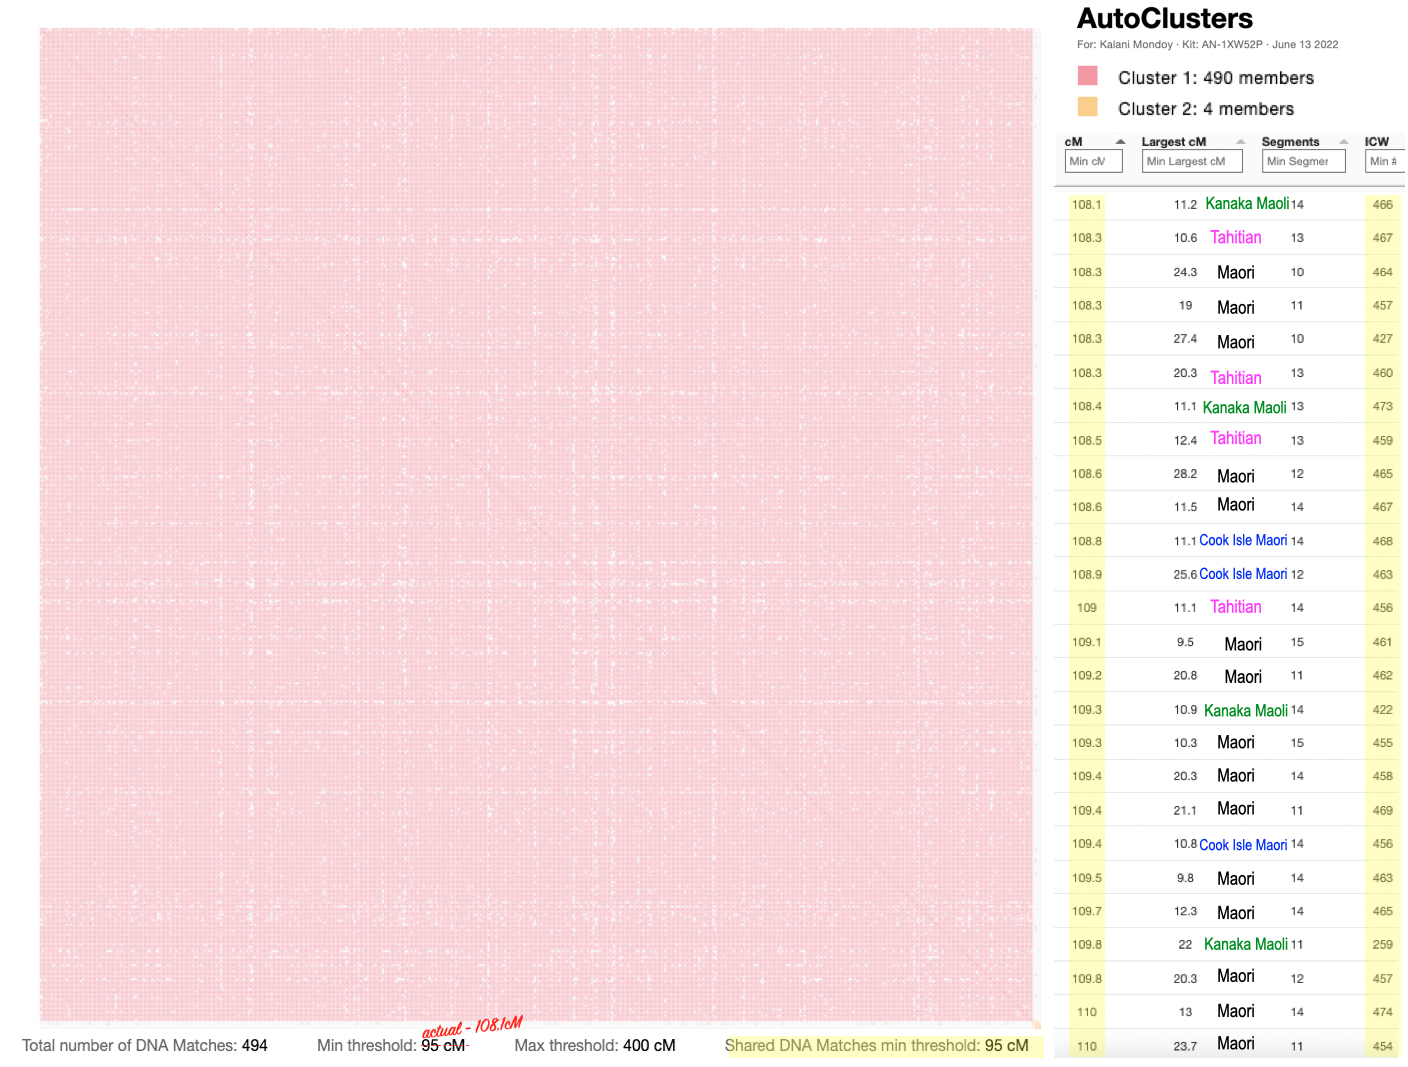
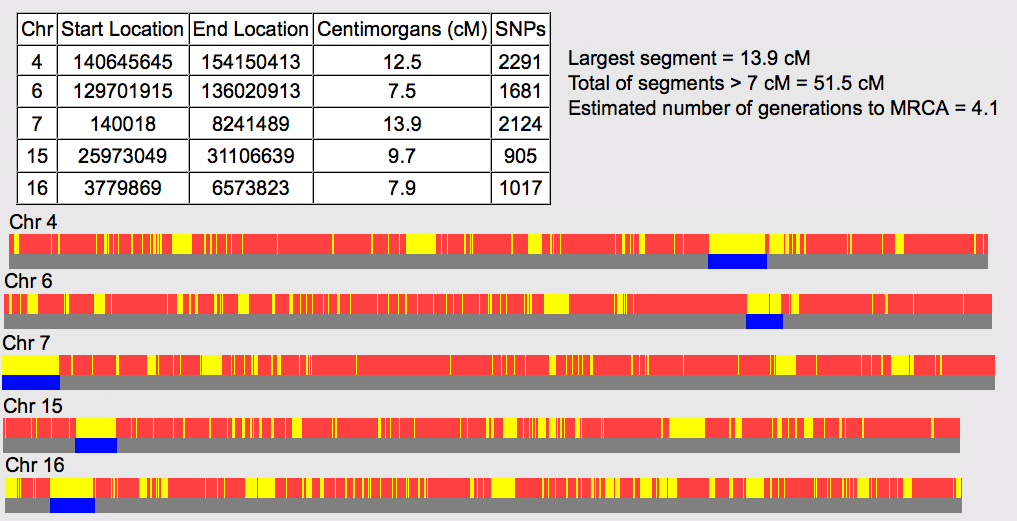
This is how GEDmatch.com shows the matches.

screen-shot-2016-09-27-at-5-39-03-am

I expected the matches at Ancestry to be not as close as they were predicted for the same reason seen with FTDNA, 23andme and GEDmatch.

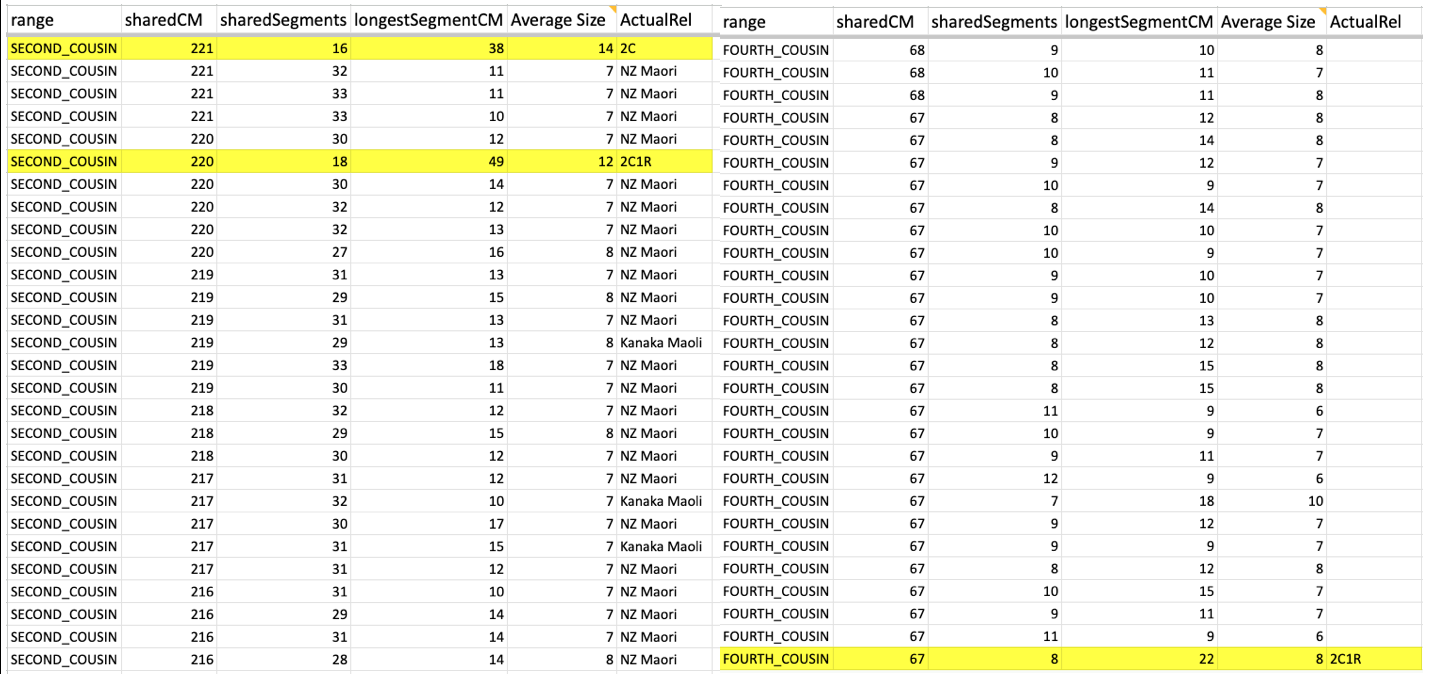
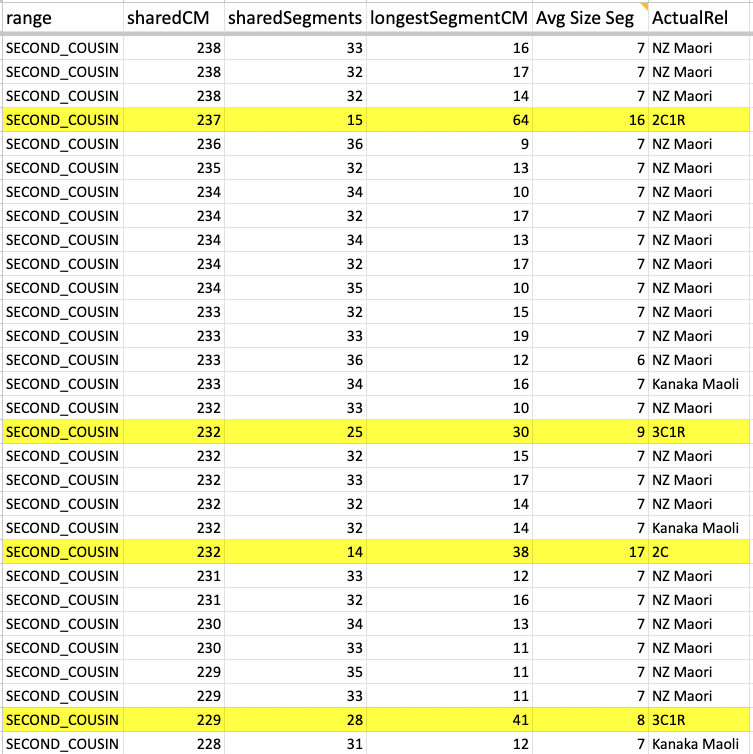
1) Several matches totaled above 100cM.
2) The largest segment usually does not exceed 20cM.
3) Matches are usually Hawaiians who do not match each other at the same amounts, and Maoris of whom we share a distant connection from 800 years ago.

As I looked at the Ancestry matches and compared the predicted 2nd – 3rd, or 3rd – 4th cousin predictions and how they appeared on GEDmatch, I noticed that they would fall in a large range of  187cM – 304cM for the total autosomal shared.

At the time I was trying to compare this close relative, Ancestry did not have the option to see how much you share, unlike now where they list the total amount of centimorgans you share and the number of segments.  But still no chromosome browser to do a full comparison.  Being able to see the largest segment would be key in determining a true close or distant 2nd or even 3rd cousin relationship.

Screen Shot 2015-07-17 at 4.01.07 PM

So there are four matches in the 1st – 2nd cousin range (Extremely High) but I could not determine if they just appear to be close, or were true 1st to 2nd cousin matches.  Given the pattern with the other companies and GEDmatch,  I ignored Ancestry for over a year, until earlier this month when I reached out to my mother’s best match at FTDNA.

DETERMINING THE BEST MATCHES FOR TRIANGULATION

My mother’s best match belongs to a woman who tested at FTDNA.  They share 266.94cM (122.9cM GEDmatch) total, and the largest segment is 50cM.  A largest segment size of 50cM is a very good indicator that the relationship was not too distant.  I guessed somewhere around a 2nd to 3rd cousin.

Last year she shared her tree with me that goes back to her ancestress named Theresa Manner, the daughter of a Swiss man and a Hawaiian woman named Kama’u.  This match’s paternal grandmother and paternal grandfather were both Hawaiian.  Kama’u was an ancestress on the paternal grandfather’s side.

Back in January I began focusing on Theresa Manner’s husband’s line, especially since his family lived in the area where my mother was born.  Not to mention I had nothing else for Theresa Manner except her parents’ names, and Kama’u was the only Hawaiian that I saw in that line.

My match asked me if I thought there was a possibility that it was her paternal grandmother’s side versus her paternal grandfather’s side.  Her paternal grandmother was also part Portuguese, but since we were not getting matches with Portuguese people I excluded the paternal grandmother’s side.  Although this match and my mother share 2 segments on the X chromosome, the largest segment 10.2cM while the other 8.8cM,  I knew it had to be distant given the unpredictability of the X particularly for Polynesians.  So I ignored it and continued to focus on the paternal grandfather’s side.

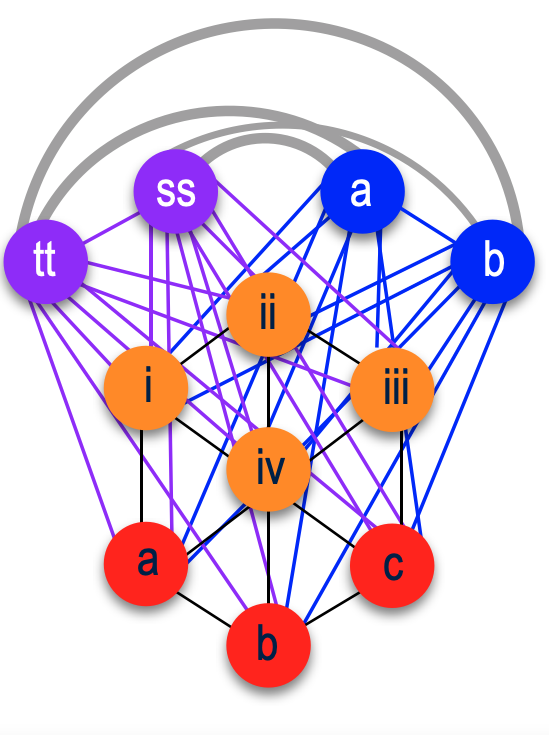
At Ancestry, my mother’s closest match belongs to a man and is the first match at the top of the diagram above.  But this match’s tree did not have any names in common with any of the other top matches that we get.  No matter how many conversations I have had with this closest match at Ancestry, although all prior to my mother revealing to me in August 2014 that she was adopted, I still was unable to find any close connection.  Given the endogamous history and the fact that we just lack genetic diversity, it seemed more of a validation that the match was not as close as it appeared to be.

 ANCESTRY RESULTS TO HELP NARROW DOWN SPECIFIC ANCESTORS

I also focused on my mother’s ancestry, which points to two basic ancestries.   East Asian and European.  Her Polynesian portion is usually represented by the East Asian and Oceanian categories combined.  Some companies such as FTDNA’s “myOrigins1” have lumped Oceanian under their East Asia category which previously their “Population Finder” separated them.  23andme also separates the two categories while AncestryDNA recently created a category called Pacific Islander (Polynesia).  Below are the results from those companies including analysis from Dr. Doug McDonald2.  For simplification I combined the Oceanian with East Asian.

Screen Shot 2015-07-17 at 4.27.09 PM

AVERAGE
81.72% = East Asian/Oceanian
17.32% = European

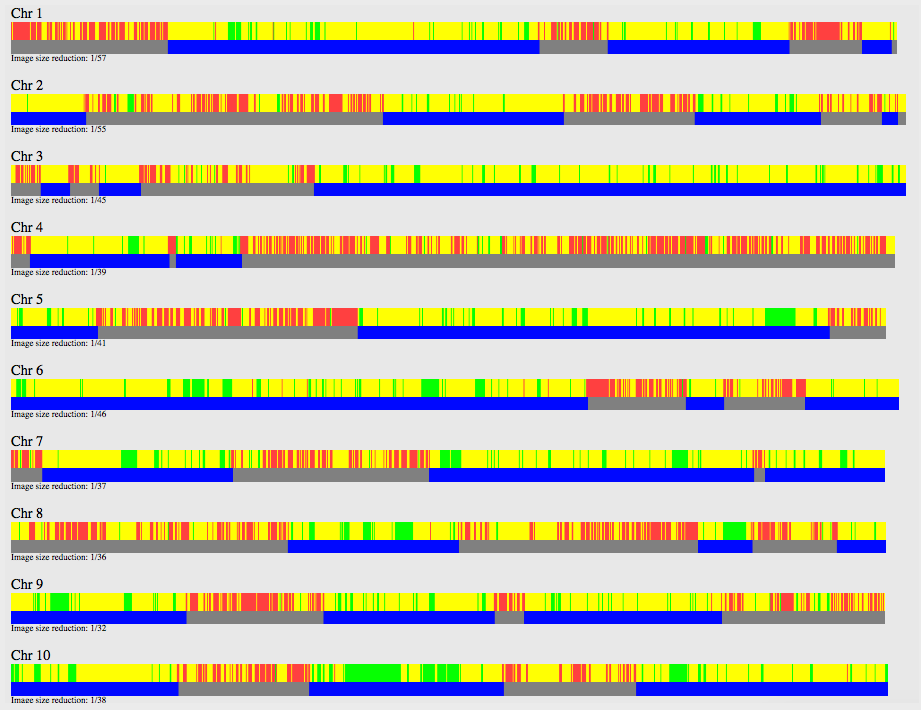
This next diagram shows 23andme’s chromosome view.  My mother’s X chromosome was just East Asian/Oceanian in origin.  Dr. Doug McDonald also had a chromosome view and he too found that it was only of East Asian.

Screen Shot 2015-07-17 at 4.23.03 PM

Knowing the X inheritance pattern, plus the amount of European percentage that my mother has, I tried to calculate who would have been the most likely European  ancestor that married a Hawaiian.  If not European, then of European descent. So I had a few clues that helped me determine how to figure out who that was.

1) My mother recalls meeting her biological father at the age of 5, and claims that he was pure Hawaiian.
2) Our mtDNA haplogroup is B4a1a1a33, a subclade of the Polynesian motif B4a1a1, indicating our direct maternal line as Hawaiian.
3) The odd percentages is probably the result of more than one ancestor being of European and Hawaiian ancestries.

Given those details, I constructed this diagram which would be the likely scenario of how my mother got her European and Hawaiian ancestries.

Screen Shot 2015-07-17 at 4.55.03 PM 

I thought that looking for her European ancestors would be easier to trace given the few early European (or American of European descent) arrivals in the Hawaiian Kingdom.  Unlike with Hawaiians whose DNA results produce closer predicted relationships than they really are.

I calculated both 18 years per generation in that diagram and 25 years for each generation.  The 25 year estimate took me to 1868 from my mother’s birth year of 1943, and back to a 50% European/Hawaiian person in that diagram.  Theresa Manner was born in 1866, so now I was confident that this could be very useful in tracing my earliest Hawaiian/European-descent ancestor.

Comparing this diagram to Theresa Manner and knowing that the estimates of the dates were very close, I realized that I did not go back far enough.  Although the predicted 50cM largest segment for a 2nd to 3rd cousin was good, it was best to be sure to go even further.

TRIANGULATION & FURTHER RESEARCH

My match at FTDNA also revealed that her father’s Y-DNA results showed a European haplogroup rather than a haplogroup indicating Polynesian origins of which her father has a direct male Hawaiian line.  Given this new information and not knowing where this NPE (non-paternal event) could have occurred, either with her father or her grandfather, or even further back,  I immediately excluded this line.  This was the same line I was previously looking into back in January, focusing on Theresa’s husband and their children and her husband’s siblings and their children.  Although still, that would not tell me for sure if that was my mother’s paternal or maternal side.

Screen Shot 2015-07-17 at 8.42.11 PM

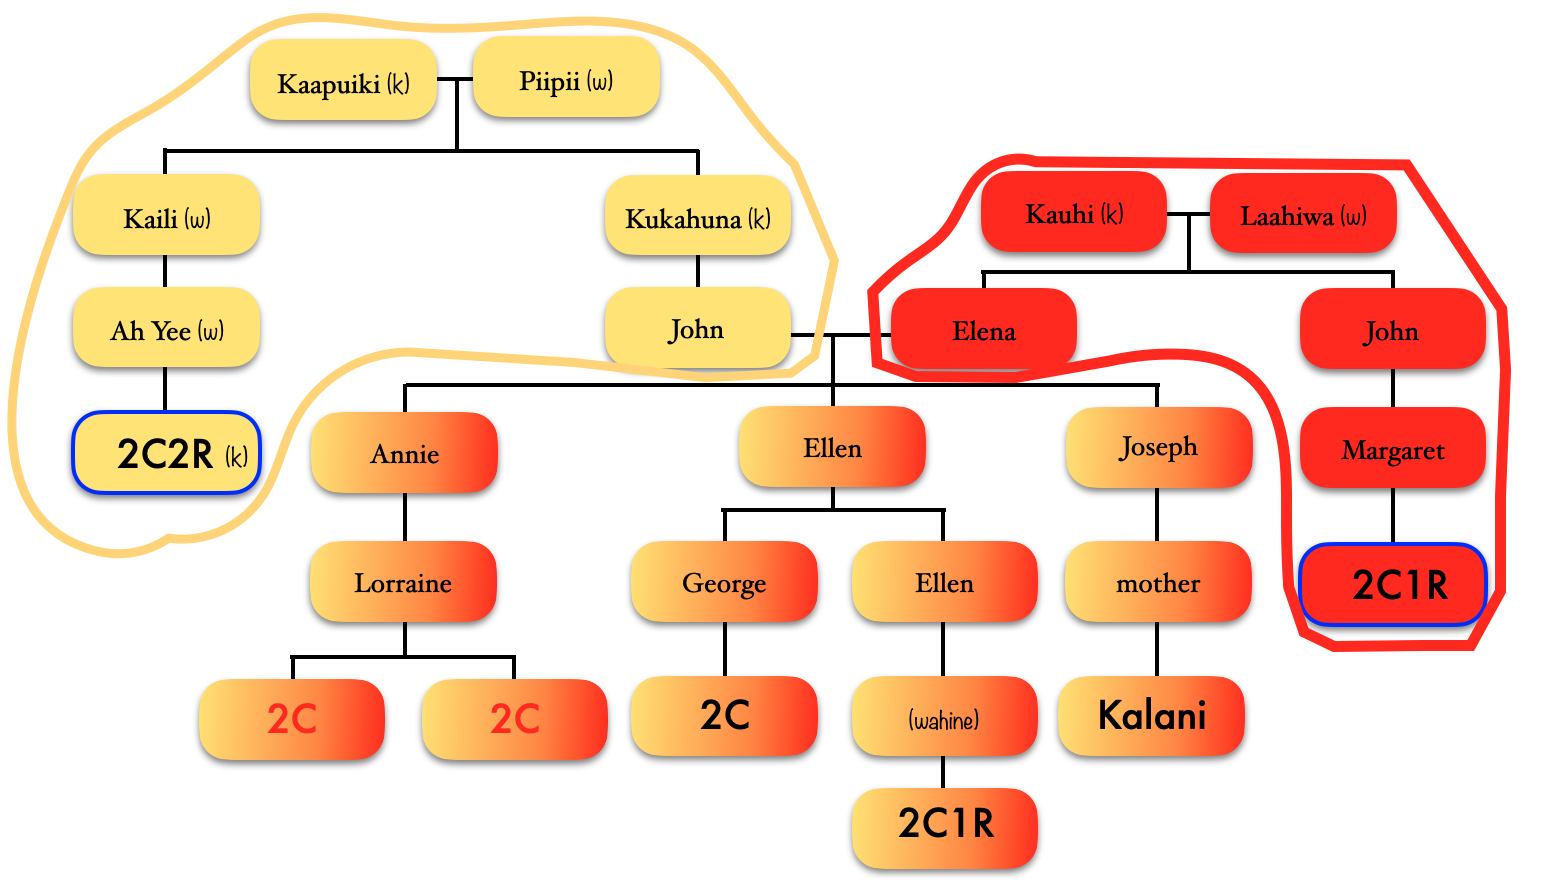
I realized how I was ignoring Theresa Manner, whose father was a Swiss and he married a Hawaiian woman named Kama’u.  I asked my match if  Theresa Manner had any other siblings.  Previously my match only shared Theresa’s parents, and Theresa’s husband and their children.  Again, because of the 50cM largest segment prediction, assuming it was pretty close, that I did not have to go back further.  But I knew that Theresa Manner was an important clue since she was half European (Swiss father) and half Hawaiian and was born in 1866.  That fit into the year I predicted from the diagram that I created in order to come up with the estimated 1868 birth for a male ancestor that was 50% Hawaiian and 50% European.  I was told that Theresa not only had 3 other siblings, but also 2 half-siblings.  They were Robert Holbron and Mereana (Mary Ann) Holbron.  Kama’u was previously married to John Holbron from England.

I thought that name Robert Holbron seemed familiar.  Since several of our top matches at Ancestry had public trees, I went back there to look and saw that the very top match of whom I have had correspondence with last year listed in his tree Robert Holbron and his wife Annie Ludlum as his ancestors.  This match is in the predicted range of 1st – 2nd cousins, although as mentioned previously, it may or may not have been a true 1st – 2nd cousin relationship.  But the fact that both of these matches had Kama’u in their line and of whom was probably the one responsible for passing on that large 50cM segment, I knew I found my ancestors.

With this new information things fell into place.  I referred to the diagram I created and it seemed that Robert was the more likely candidate to fit into what I had constructed as my possible ancestors.  But to be sure, I looked into his sister’s descendants first.  Mereana Holbron married an Irish man, lived in Ireland and in Hawaii.  But Robert appeared to fit the pattern I mapped out more than his sister, although his wife Annie had a surname of Ludlum, which indicated that she was an admixed Hawaiian unlike in my diagram.  But even with her being half, I knew that her mother was Hawaiian based on the fact that if Annie were my ancestor, her mother would have passed on my B4a1a1a3 directly to Annie and down to females.  And that matched up with my diagram.  My match’s tree at Ancestry listed Annie’s parents as William Ludlum and Ehu, which confirmed that Annie was half Hawaiian and of half European descent.  Later, I would find that both Robert and Annie’s estimated year of birth fit the diagram and predicted year of birth only off by 13 years.

While going through several of the old Hawaiian newspapers I found an article with a photo of Mrs. Annie Holbron celebrating her 100th birthday.

From Frank Hewett's site: http://www.loeahula.com/

Annie Ludlum

SPECIFIC BRANCH NARROWED DOWN

I continued looking into Robert and Annie’s children and grandchildren.  I focused on their oldest daughter Rose Holbron and her husband Frank Kanae, and who our top match at Ancestry descends from.  And although I made sure I covered many of the collateral branches, I still used as a guide the diagram I created to guide me into which branch it could be.  And it took me to Rose & Frank’s 3 daughters.

While looking for their descendants and who they married, one of them had a photo uploaded into their tree on Ancestry,  and I saw the striking resemblance not only to my mother but also to my sister. I found information on her husband and children and she had one child born just a month before my mother was born.  So it seemed unlikely that this was my mother’s biological mother.  This is on the assumption that my mother’s birth date on her “legal birth certificate” is her actual birth date.  I could only assume that it may have been one of the other two sisters who was my mother’s biological mother based on the fact this woman looked like both my mother and sister.

I definitely found the right family for my mother’s maternal side.  It would be only a matter of time before I find out if the woman whose photo I found was my mother’s biological mother, or her mother’s sister.

EVALUATING ALL CLUES

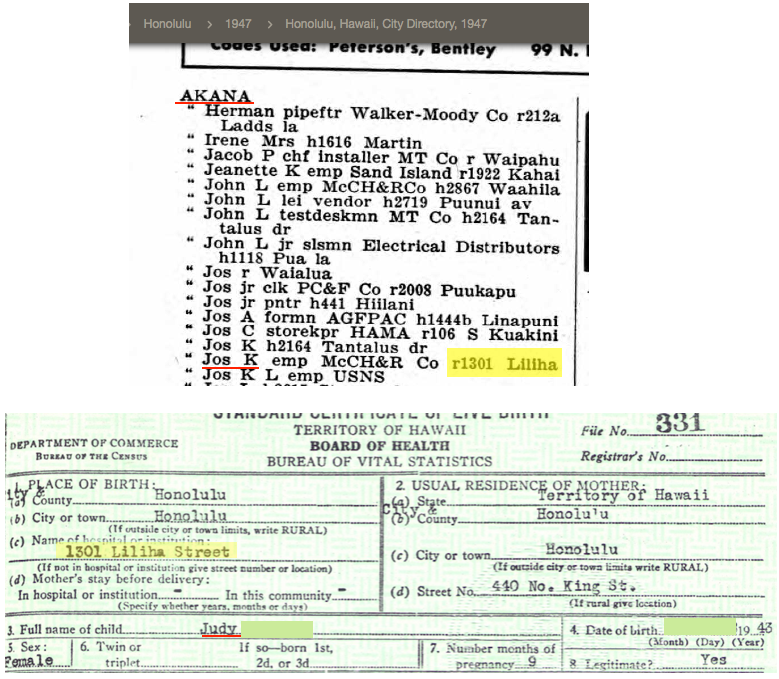
My mother’s legal birth certificate left questionable details since I began researching 26 years ago. It was because it did not indicate that it was an adoption, unlike my own birth certificate which clearly states that it is an adoption. What was known and is clearly indicated on my mother’s birth certificate.

  • Birth was not a hospital or institution but at a residence – 1301 Liliha St. (Honolulu)
  • A midwife was present, attested to witnessing the birth of Julia Kawewehi Scott [adoptive mother].
  • Usual residence of mother was 440 N. King St,  which was the permanent residence of both parents.

I spent several years looking into the address where my mother was born. I even tried to track down people who lived at the same address hoping to find someone who was alive at the time my mother was born and may know something about her birth mother.

Now that I have found the branch that we come from, again I continued to look into Rose Holbron and Frank Kanae’s daughters.  I already found one with a photo who resembles my mother and sister.  Another daughter I found was married several times, and had children from possibly more than just her own husbands, but this is based on surnames.  Her name was Rose Kanae, and her first husband was surnamed Kalei.  Her second husband was Joseph Akana, which can be a semi-common name.  A lot of Akanas, but not all are related to each other from what I saw with their last known ancestor to some of the Akanas that I found.  That surname comes from a Chinese who either became a Hawaiian citizen or just Hawaiianized his name.  That surname caught my attention and made me think about it for a bit, but given that I had done a lot of genealogy I know and do remember seeing that name and reading about that surname in other Hawaiian genealogy forums.  Then after Joseph Akana, Rose married a third time.  All of those husbands gave her children.

I was surprised to find in the city directory of 1947, that Joseph Akana lived at 1301 Liliha Street.  This was the same exact address where my mother was born.  So either this woman got pregnant from another man and Joseph Akana divorced her, or her sister got pregnant and gave birth at their residence.

Screen Shot 2015-08-01 at 5.13.28 PM

At the same time I found the photo of the woman who could be my mother’s biological mother, my mother called to tell me that she received her non-identifying form from the First Circuit Court in Kapolei, O’ahu, Hawai’i.  This form just gives adoptees little information into their background and every state and court has their own way of determining what will be revealed.  For Hawaii, it is the ancestry.

When I received a copy of it, it indicated that my mother’s mother was Hawaiian and Chinese while her father was Chinese Hawaiian.  However, DNA does not support that.

Non-Identifying Form - letter form

Non-Identifying Form – letter form

But given the non-ID form indicating Chinese, although incorrect, this was pointing to Joseph Akana and Rose Kanae as the parents listed.  Joseph Akana’s surname was the only clue that made me believe he was not the biological father.  I had even suspected that there may have been a question of paternity with Joseph Akana and what may have caused my mother to get adopted, hence Joseph divorcing and my grandmother remarrying.

I was also told that back then, no matter which state, particularly for unwed mothers, if the biological mother knew who was going to adopt the child, she might take on the identity of that woman and check into the hospital as that person.  The woman who adopted my mother – Julia Kawewehi was Hawaiian and Chinese.  So I assumed this is what happened unless Rose Kanae really did not know her ancestry.  The DNA evidence indicates a near perfect 70% East Asian to 30% Oceanian component consistent of Polynesians4.  Whereas those who have some Asian ancestry in addition to Polynesian, the percentage of East Asian to Oceanian would be much more significant than 70%.  Therefore either the parents listed in the adoption files really are not her parents or they were just wrong with the ancestries of the parents.

THE FOREIGN ANCESTORS

After getting more details on my maternal grandmother Rose Kanae’s branches, I was able to see exactly all of the foreign men who married Hawaiian women in her line.

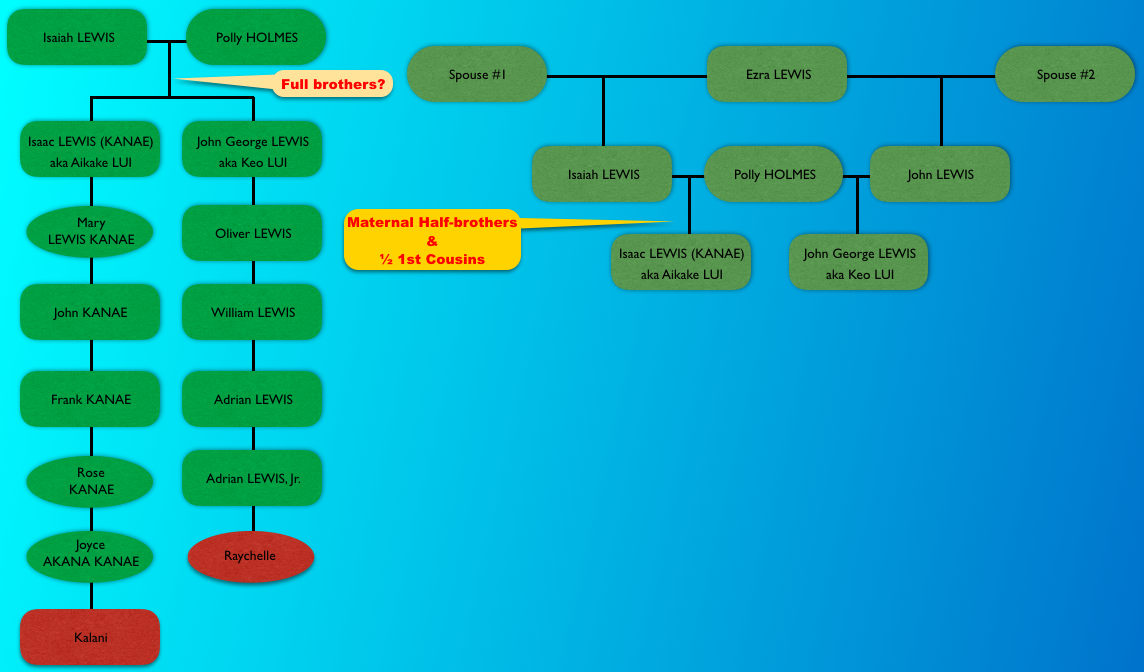
1) Oliver Holmes, (later Hawaiianized to Oliva Homa) an American who arrived on the island of O’ahu in the Sandwich Isles on October 8, 1793 on board the Margaret, who was in service of the chief Kalanikupule.  After Kalanikupule’s death in the Battle of Nu’uanu, Holmes married Mahi, the daughter of the high chief of Ko’olau5 whose name was Kalaniulumokuikekai6.  After Kalanikupule was defeated by King Kamehameha, along with Mahi’s father Kalaniulumokuikekai, Oliver and others were taken by Kamehameha and became advisors for the King.  In 1810 after King Kamehameha united all the islands, Oliver became the 3rd Governor of O’ahu.  Governor Homa, as he was called, remained in Honolulu and had one son and five daughters.  One of the daughters – Hannah Holmes married Captain William Heath Davis Sr, and their son William Heath Davis, Jr. ended up in California in San Francisco and was also one of the original founders of New Town San Diego7. Oliver’s other daughter Polly married Captain Isaiah Lewis and it was said that she traveled with him to the northwest coast.  Oliver had three other daughters, all of whom married captains of ships coming into the Hawaiian islands.

2) Captain Isaiah Lewis, an American and son-in-law of Oliver Holmes.  He commanded the Panther, and acquired sandalwood in Hawaii and sold it in Canton, China.  He married Polly Holmes, the daughter of Oliver Holmes & Mahi.

3) William Ludlum, an American whaler from Jamaica, Queens, New York who became a citizen of the Hawaiian Kingdom on August 7, 1850.  He married a Hawaiian woman named Ehu on January 24, 1850 in Mapulehu, Molokai.  He ran a hotel & was a Commission Agent.

4) John Holbron [John Halborn/Holborn], originally from Hull, England arrived in the 1840s.  He married a Hawaiian woman named Kama’u and became a citizen of the Hawaiian Kingdom on November 24, 1845.  He was a merchant.

After knowing for sure who these foreigners were, I was able to re-design that diagram and came up with new percentages of each ancestor.
EA/Ocean = East Asian/Oceanian

Screen Shot 2015-08-05 at 3.23.35 PM
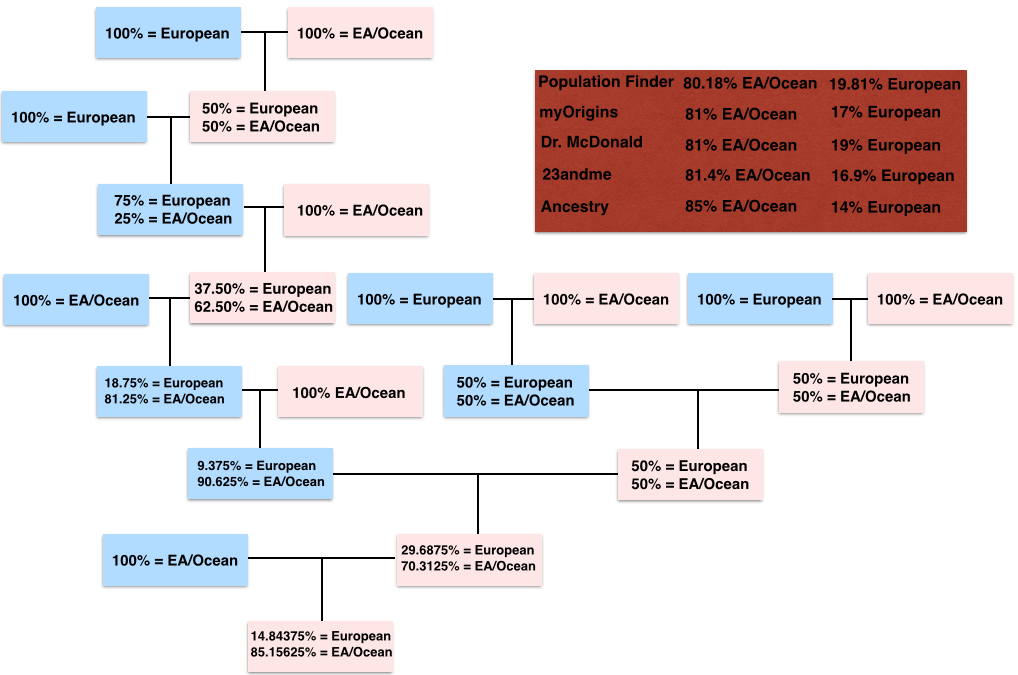
The light blue represents the male, the pink the female, and the bottom is my mother of which is calculated 14% European and 85% East Asian/Oceanian.  My mother’s results fall into that range of 14% – 19.81% European and 80.18% – 85% East Asian/Oceanian.

MISLEADING X MATCH

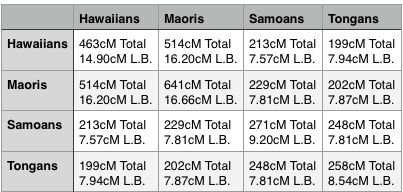
While my match at FTDNA did share 2  X segments with my mother (via her father of whom both of his parents were Hawaiian), the fact that I ignored it because of how unpredictable the X is lead me on the right path.  The largest segment size is 10.2cM  and the other is 8.8cM.  I have seen how a significant amount of X my mother shares with other Polynesians (i.e. Samoans, Tongans & Maoris) can be so distant.

While it can be useful in excluding certain branches, this is obviously not the case for endogamous groups, particularly not for Polynesians.  Had I focused on the X path, I would not have made the connection at all.  But it is not surprising that this male shares a distant X match with my mother on his mother’s side yet not have a recent tie to my mother on his maternal side, at least not that I have figured out just yet.

CONFIRMATION OF BIOLOGICAL PARENTS

My friend Charles Ano who have helped me with genealogy searches in the past decided to look up birth announcements in the newspaper around the time that my mother was born based on all of this information that I found.

Screen Shot 2015-11-06 at 2.02.39 PM

Birth Announcement – Honolulu Advertiser – Sept 28, 1943

It listed her original name – Joyce Awapuhiokala (Akana).  I did not want to reveal this to my mother just yet since I completed the last step of accessing her adoption records just the other week.  I wanted my mother to receive copies of the actual adoption files and see for herself who they listed as her parents and her original name.

Eventually my mother found out that I knew of her original name, and after I got a chance to speak to her about it, she told me that she already knew she was born Joyce  and that she was related to the Akana family, and also had a Hawaiian name, but she did not know what that name was.  She was about 9 years old when she found out about all of this.

I did tell her that I remember her mentioning the surname – Akana.  And I knew that when I found Joseph Akana, there was something about that name that seemed familiar but could not remember exactly.  I later realized it was last year after almost giving up on DNA and before resorting to accessing her adoption files via the court, I had turned to the 1940 census, just three years before she was born and looked for the place where she was born.  It was at that time I asked her about the family names, people who lived at that address where she was born to see if it seemed familiar. None did, but it was at that time when she asked, “what about Akana?”  I never asked her much more about it, but remember she did comment about how she heard that was her family.  Unfortunately, I forgot about this important clue.

CONTACTING COUSINS – BIOLOGICAL FATHER CONFIRMED

Now knowing my mother’s original name, I decided to seek out my cousins, children of my mother’s siblings.  I already saw names of some of them based on the obituaries I found of my mother’s siblings.  I first contacted a woman whose surname matched my mother’s brother and with whom I already had contact with because at the beginning of accessing my mother’s adoption files I simultaneously tried to get my original birth certificate since my adoption was done at another court.  My adoption was a technical issue.  The mother that I speak of is my biological mother.  It turned out that this contact is a granddaughter of my mother’s brother.  After sharing with her who my mother is, what name she was born, who her parents are and identifying the other siblings based on what I found in the obituaries, she notified both her grandfather and a sister living on another island.  I sent photos of us and she shared it with her great-aunt and grandfather.  She remarked at the strong resemblance of my mother and her great-aunt.

At the same time, I found another cousin on Facebook, contacted our mutual friend and that friend revealed how this cousin probably knew my mother.  Turns out that this cousin and my mother have known each other for the past 6 years.  This cousin also told my mother at first meeting her 6 years ago that she reminded her of his aunt.  This was the same person that the other woman commented of how my mother looked like her great-aunt.

In a few days after having other cousins contacting me, they revealed the entire story of how our grandmother Rose Kanae married three times, and with her husband Joseph Akana she had four children.  A daughter who carried the surname KALEI which was the surname of Rose’s first husband.  Another daughter and of whom is the only sister to my mother that is alive, the one who we are told my mother looks like.  Then a brother and finally my mother.  Then with the last husband, Rose had two sons.  The youngest is alive and whose granddaughter I first contacted.

Only the sister that is still alive and one of the younger half-brothers were the only two children that were not given up for adoption.  The other seven children were all given up for adoption.  The older ones knew of my mother’s existence.  But what they knew was that they had a sister named Joyce Akana who was given up for adoption by a Filipino family.  My mother’s adoptive father was Filipino.

Then it was revealed to me how Joseph Akana really was my mother’s father, but Akana is a surname he took on later in life and was the surname of his paternal aunt’s husband.  His original name was Joseph Napua Kaapuiki and was a pure Hawaiian man just as my mother remembered.  And Joseph did frequent the area and since my mother grew up right by where she was born, it is no surprise that she actually did encounter her father.

And as difficult as this was given the situation with Polynesians and endogamy, it can still be done.  It would just mean that every match, especially when it comes to geographic location should be scrutinized in order to determine a really close match or not.

I was there on November 1, 2015 when my mother and her sister Stella got to meet each other.

mom-stella

My mother Judy on the left, with Aunty Stella on the right.

This blog entry was edited after new evidence confirmed my mother’s paternity and after she was reunited with her sister.  In May 2016 my mother received her adoption files which listed her biological parents as Joseph Akana and Rose Kanae, listing my mother’s name as Joyce Awapuhiokala Akana aka Joyce Awapuhiokala Kanae.
screen-shot-2016-09-29-at-4-40-06-am

screen-shot-2016-09-29-at-4-41-43-am


Footnotes

1. MyOrigins v1 May 2014 – April 2017.  MyOrigins v2 separated the Oceanian from the East Asian and currently Oceanian falls under the broader Central/South Asia category.
2. Dr. Doug McDonald developed a the Biogeographical Analysis software and was contracted with Family Tree DNA to write the underlying code for their Population Finder ethnicity software.
3. Phylotree build 17 currently is B4a1a1c.
4. Population Genetic Structure and Origins of Native Hawaiians in the Multiethnic Cohort Study shows that autosomal results for Native Hawaiians consist of 68% Southeast Asian and 32% Melanesian components.
5. Day, A. Grove. (1984) History Makers of Hawaii. Honolulu: Mutual Publishing of Honolulu. pp. 53.
6. Honolulu Star-Bulletin – Monday, June 20, 1960: Tales About Hawaii – Oliver Holmes Founds a First Family.
7. William Health Davis, Jr.

Botocudo ancient DNA sample uploaded on GEDmatch

Felix Immanuel, a software professional at Hewlett-Packard based out of Canberra, Australia who has a Bachelor of Engineering in Computer Science and a Master of Science in Forensic Computing and Cyber Security from University of South Australia, has been uploading a bunch of ancient DNA to GEDmatch.com.  The most recent uploads were samples taken from skulls of two extinct Botocudo (Brazil) men.  I blogged about it in December 2014.

https://hawaiiandna.wordpress.com/2014/12/12/polynesian-mtdna-in-botocudo-of-brazil/

At that time, they hypothesized a few ways how the Polynesian motif could have made it into the genome of these now extinct Botocudo tribe.  But recently in Two ancient human genomes reveal Polynesian ancestry among the indigenous Botocudos of Brazil (http://www.ncbi.nlm.nih.gov/pubmed/25455029), they talk about the hypotheses again and how they came to the conclusion that these samples are definitely Polynesian.

One thing that was consistently repeated, was how the skulls analyzed had no detectable Native American ancestry.  They say, “[w]e find that the genomic ancestry is Polynesian, with no detectible Native American component.”   That “all the genetic data point towards two individuals with Polynesian ancestry and no detectable Native American ancestry.” And they continued again saying that a “clustering analyses suggest that they have no detectable Native American ancestry and share the same components as the Polynesian population.”

The two male individual samples used, known as Bot15 and Bot17, presented a combination of mitochondrial DNA (mtDNA) variants common in present day Oceanian populations.

They pointed out a few hypotheses that was mentioned in the other paper, and that “the 1862-1864 AD Peru-Polynesia slave trade can be excluded, given that the 14C calibrated dates for the skulls predate the beginning of this trade.”  Because these skulls have been radiocarbon dated, the dates that they came up for Bot15 was 1479 – 1708 AD and 1730 – 1804 AD, and for Bot17 was 1496 – 1842 AD.  So the fact that the Peru-Polynesia slave trade occurred after the death of these people excluded the hypothesis that Polynesians were brought over during that slave trade.

Also, the Madagascar-Brazil slave trade hypothesis has been excluded due to the recent genomic data that demonstrated that the Malagasy ancestors admixed with African populations prior to the slave trade, and no such ancestry is detected in the Botocudo sample.  Madagascar was peopled by Southeast Asian and not Polynesian populations.

And finally, trade involving Euroamerican ships in the Pacific only began after 1760 AD.  By 1760 AD, both Bot15 and Bot17 were already deceased with a probability of 0.92 and 0.81, respectively, making this scenario unlikely.

These two samples analyzed had no Native American component detected.  Felix was able to extract SNPs from the raw data to come up with C-PH3092, and  C-Z31878, which are Melanesian in origin and the C haplogroup is common in eastern Polynesia.  The mtDNA haplogroups were B4a1a1a and B4a1a1.  B4a1a1a is pretty common throughout Polynesia especially in eastern Polynesia.  And most importantly these samples are a match only to eastern Polynesians.  There is no doubt that these particular samples are Polynesians.  Question is, how did they get there?  Did they manage to produce offspring with the local Botocudo groups like the Crenaques, Nac-Nuc, Minia-Jirunas, Gutcraques, Nac-Reques, Pancas, Manhangiréns or Incutcrás?  Or did they have offspring but they never survived?  Were these samples that were found the actual people who traveled directly from Polynesia?  Or did they arrive as a group and intermarried within their own group of Polynesians but later were found among the other Botocudo people?   And why travel thousands of miles over mountains and crossing rivers, possibly going through or bypassing the Pantanal that borders Bolivia and Brazil and continue to head towards the east?

We have other evidence like the kumara [sweet potato] or ‘uala [Hawaiian word for sweet potato] that originated from South America, and not to mention our many oral traditions of all the famous travelers who went abroad to Kahiki [foreign lands; Tahiti] and towards ka hikina [the east] where the rising of the sun is.  Travelers like Kuali’i, Hema, Kaha’i, Wahieloa, Laka and Luanu’u. Now DNA is showing the scientific community what we have known based on our oral traditions.

Now that Felix uploaded both of these samples up on GEDmatch.com, we see that both of the samples matches a few of us [both admixed and non-admixed] Hawaiians (including my mother), Maori, and a Cook Island Maori.  No surprise that eastern Polynesians are a match, given how they lack genetic diversity much more than the older western Polynesians. But it may also suggest, if not confirm, that it was specifically part of the expansion of eastern Polynesians.  But was there another expansion that late in the 1600s?  Another not so surprising thing about these matches is that there may be small segment matches, but when utilizing GEDmatch’s graph when comparing ONE TO ONE, we can still see small segments of full identical region for a few of these matches.

Bot17,Brazil,0.4ky1
Kit # F999964
mtDNA – B4a1a1
Y DNA – C-Z31878 (C1b2 [2015])

Bot15,Brazil,0.4ky
Kit # F999963
MtDNA – B4a1a1a
Y DNA – C-PH3092 (C1b2 [2015])

You can check out Felix’s blog for other ancient DNA uploaded. http://www.fi.id.au/

Also the supplemental information can be accessed here.

Footnotes

1. Y haplogroup C Botocudo sample is carbon-dated to 1419-1477 AD – Ray Banks

Comparing Western and Eastern Polynesians

In my last blog entry “Tiny Segments from the Same Common Ancestors“, I began comparing Western Polynesians (Samoans & Tongans), and Eastern Polynesians (Maori and Hawaiians), and compared them to each other in order to show how the tiny segments appeared like missing teeth on the chromosome browser.  Now I will show how people compare to each other based on total centimorgans and their longest block (FTDNA).

First I compare Tongans and Samoans to each other.  Both Samoans and Tongans are Western Polynesians and are the most diverse.   Polynesian settlement began in the west in the Tonga/Samoa/Fiji area.  I mentioned this in a previous entry “Loss of heterozygosity – from Western Polynesia to Eastern Polynesia.”

T = Tongan
S = Samoan
– = no match

I colored it to make it easier to see or compare Tongans to Tongans in light green, and Samoans to Samoans in light blue.  The ones not colored are comparing Samoans to Tongans.  The top number is the total shared in centimorgans, while the bottom number is the longest block (largest segment).  The average totals seem to be between the upper 200s to mid-300s. The lower numbers (in the hundreds) is due to the fact that the person is admixed.  In other words, they are not pure Samoan/Tongan, and usually have some European ancestry.

WestPoly

Comparing Tongans to themselves:
TOTAL
lowest –  117cM (part Tongan)
highest – 340cM
average – 258cM

LONGEST BLOCK
lowest – 5.79cM
highest – 10.51cM
average – 8.54cM

Comparing Samoans to themselves:
TOTAL
lowest – 165cM (part Samoan)
highest – 366cM
average – 271cM

LONGEST BLOCK
lowest – 5.66cM
highest – 16.54cM
average – 9.20cM

Comparing Tongans to Samoans:
TOTAL
lowest –  143cM
highest – 321cM
average – 248cM

LONGEST BLOCK
lowest – 5.79cM
highest – 11.07cM
average – 7.81cM

This is what it looks like when I compare those same Tongans and Samoans to Hawaiians and Maoris who are Eastern Polynesians.

H = Hawaiian
M = Maori
T = Tongan
S = Samoan
? = unable to determine if a match
– = no match

In this graph, I again colored it for easy comparison.  Hawaiian vs. Tongans in light brown, Hawaiians vs. Samoans in golden yellow, Maoris vs. Tongans in pink, and Maoris vs. Samoans in light green.

West-EastPoly

Most of the Eastern Polynesians are admixed except for two Hawaiians and one Maori.  But those that are admixed are still more than 75% Polynesian which still keeps the totals fairly high as you can clearly see it still above one hundred with the exception of one Hawaiian who is admixed to the Tongan that is admixed.  In fact, that admixed Tongan only shares with one Hawaiian and one Maori, both less than 100cM.  Yet their longest block still falls within the range.

Comparing Hawaiians to Tongans:
TOTAL
lowest – 72cM
highest – 341cM
average – 199cM

LONGEST BLOCK
lowest – 5.34cM
highest – 12.12cM
average – 7.94cM

Comparing Hawaiians to Samoans:
TOTAL
lowest –  135cM
highest – 314cM
average – 213cM

LONGEST BLOCK
lowest – 5.09cM
highest – 11.50cM
average -7.57cM

Comparing Maoris to Tongans:
TOTAL
lowest –  68cM
highest – 240cM
average – 202cM

LONGEST BLOCK
lowest – 5.31cM
highest – 10.94cM
average – 7.87cM
Comparing Maoris to Samoans:

TOTAL
lowest –  147cM
highest – 278cM
average – 229cM

LONGEST BLOCK
lowest – 5.28cM
highest – 10.94cM
average -7.81cM

When looking at the average, it seems to be consistent as far as comparing Eastern Polynesians to any Western Polynesian.  However that changes drastically when comparing Eastern Polynesians to themselves.

H = Hawaiian
M = Maori
? = unable to determine if a match
– = no match

I colored Hawaiians in light blue and Maoris in light green when comparing to themselves.  The non-colored portion is when they one group is compared to the other.

EastPoly

Comparing Hawaiians to Hawaiians:
TOTAL
lowest –  225cM
highest – 780cM
average – 463cM

LONGEST BLOCK
lowest – 8.45cM
highest – 23.58cM
average -14.90cM

Comparing Maoris to Maoris:
TOTAL
lowest –  581cM
highest – 694cM
average – 641cM

LONGEST BLOCK
lowest – 12.51cM
highest – 19.98cM
average -16.66cM

Comparing Maoris to Hawaiians:
TOTAL
lowest –  291cM
highest – 773cM
average – 514cM

LONGEST BLOCK
lowest – 8.98cM
highest – 29.68cM
average -16.20cM

So to recap, showing just the average total shared and the average longest block size:Screen Shot 2015-04-20 at 4.45.54 PM

Although I used only 3 Maoris compared to 8 Hawaiians, it was based on the top matches to my mother.  There were a few more Maoris but I did not have access to their data and that would have allowed more “?” in the charts.  But as we can see, the Western Polynesians tend to have lower totals since they are more diverse unlike the Eastern Polynesians.  More admixed Polynesians will result in lower totals, but the longest block is not that much difference from those not admixed.

In the future I will probably attempt to look at admixed Polynesians and compare them to show the average longest block sizes compared to those not admixed.

Tiny segments from the same common ancestors

Disclaimer: This post demonstrates the use of 1+cM when comparing specific groups of people in order to see patterns of multiple descent from a few ancestors.  It should not be used to validate connections with matches, particularly in this example where connections are beyond a genealogical time frame reaching at least up to 500 years.

Recently I have been comparing both western Polynesian (Tongan and Samoan) and eastern Polynesian (Hawaiian and Maori) matches.  I compared western Polynesians among themselves, and  did the same thing with eastern Polynesians comparing them among themselves.  Then I compared the two groups to each other.

To those who are not familiar with Polynesian origins and/or are new to reading my blog, I will recap.  The ancestors of Polynesians originated from the Melanesia area and thrived there for thousands of years. Thousands of years later a group of “Austronesians” originating from Southeast Asia moved into the area, intermingled briefly and continued to move into western Polynesia where Polynesian culture was born.  At least a couple of thousand of years would pass before they would continue to expand further eastward.  As Polynesians moved from west to east, their genome became less diverse due to repeated founder’s effects and bottle necking.

oceania

I analyzed my mother’s results and compared her to a Hawaiian (orange), and a Maori (blue) below.  The Hawaiian is her top match, sharing a total of 693.60cM, longest block 15.52cM, consisting of 158 segments.  The Maori is her 4th top match sharing a total of 517.90cM, longest block 18.08cM, consisting of 119 segments.  FTDNA counts all the tiny segments as low as 1cM once the criteria of a match is met, which is why the number of segments is high.

tinyseg-mom

With the default at 5+cM I did not see anything unusual other than ordinary small segment matches.  But when I reduced the setting down to 1+cM (above), you can see a lot of tiny segments resembling a comb.  The slightly bigger gaps are just the missing teeth of a comb.  Some of these patterns begin to appear at 3+cM, although most do not appear until you reduce it down to 1+cM.  In my mother’s example above I show only chromosomes 1 – 20 since there were no segments that looked like a comb on the other chromosomes.

Then I looked at a Maori woman’s results (below) and compared hers to other Maoris and one Hawaiian.  She also shows the missing teeth at 1+cM, but only in a few areas.  Some areas have the comb pattern while other areas seem random.  The random segments could be IBS (Identical by State) or IBD (Identical by Descent).  Polynesians lack genetic diversity, particularly eastern Polynesians more than western Polynesians, so the random looking segments could be both IBS and IBD segments.

tinyseg-mary

Then I looked at two Tongan men and compared them to other Tongans and Samoans.  With Tongans & Samoans there seem to be more randomness.  A few of the tiniest segments may be close to each other, but nothing resembling too much like my mother’s results, a definite comb-pattern.  Take the purple and green colors for example for this one Tongan man below.  Notice how on some chromosomes they seem to be closer together while on others it just looks random.  Again, these are only using the bare minimum 1+cM.

tinyseg-peni

The other Tongan example.

tinyseg-keni

As you can see, it is hard to look for patterns that resembles a comb, and instead you see random colors all over the chromosomes.  What was interesting to see was how little X these Tongans had.  Unlike with the Maoris and Hawaiians, many of them shared multiple segments with each other.

But what does all of this mean?  These are very small island populations.  They have had repeated emigration from these small islands that resulted in a series of founder’s population.  There there was also bottle necking that occurred a few times.  All of these combined would leave only a few closely related ancestors to populate and repopulate new areas every time.

So the multiple, very small segments that represents a comb with missing teeth is the result of people descending from just a few ancestors who contributed that particular segment, but was inherited from multiple lines going back to the same ancestor over and over again.

Below is an image where I compare my mother with two Samoans (yellow & green) and three Tongans (orange, blue & purple).  There seems to be more randomness, however, there are a few of those comb patterns.

tiny-mom&western

Notice how the X chromosome is much more full, unlike what we saw when comparing the western Polynesians (Tongans & Samoans) among themselves. The yellow color belongs to a Samoan woman. The fact that women have 2 X chromosomes may be the reason why there is a long match versus using two Tongan men whose matches included two women in their examples above.  But these are Polynesians, so you would expect more of a match on the X.  My observance of matches for the past 2 years was limited to only my mother being compared to others, which means I have seen a lot of X matches for her, and the same for myself and my brother.

From what I am noticing so far is that these patterns look like what is mentioned in research papers about Polynesian genome and the loss of heterozygosity going from west to east.  The last place in Polynesia to be settled was in the east, ending at the extreme points of the Polynesian triangle, namely Rapa Nui (Easter Island) in the south east, Aotearoa (New Zealand) to the south west, and the Hawaiian islands in the north.  This explains why my mother and the Maori woman have less random looking tiny segments compared to the Tongans and Samoans.  And if we compare western and eastern Polynesians to each other, we may see some randomness but not as much as we would see with western Polynesians alone.  Other types of Polynesians getting DNA tested would help to exhibit any other additional patterns that I cannot currently see with the majority of Hawaiians and Maoris getting tested.

Loss of heterozygosity – from Western Polynesia to Eastern Polynesia

Genetic research on Polynesians will frequently mention the loss of heterozygosity.  This is more noticeable when comparing eastern Polynesians to western Polynesians.

oceania

Map outlining migratory paths of Austronesian speaking populations, including estimated dates. Adapted from Bellwood et al., (2011) “Are ‘Cultures’ Inherited? Multidisciplinary Perspectives on the Origins and Migrations of Austronesian-Speaking Peoples Prior to 1000 BC.” [doi: 10.137/journal.pone.0035026.g001

Polynesian populations are relatively homogenous both phenotypically and genetically. Over a span of 3,200 years they moved throughout the Pacific, and unlike in Europe and other large continents, they did not mix with other populations due to isolation.  These small founder populations have experienced several bottleneck effects, which further caused this loss of heterozygosity ending with the settlement of eastern Polynesia.  Polynesians’ lack of genetic diversity is less evident in western  Polynesia where initial settlement began.  Hawai’i, New Zealand and Easter Island are considered to be eastern Polynesia, and these places were the last places of Polynesia to be settled.

Recently I have been able to look at the autosomal matches among Samoans and Tongans of western Polynesia.  Previously, I have been only studying Hawaiian matches and noticed that top matches were both Hawaiians and Maori people.  Looking at Samoans and Tongans was very interesting as I now could compare the two different regions.

My mother is 80% Hawaiian, while I am 40%.  And as admixed as I am, I still get 1st – 3rd cousin predictions on Family Tree DNA (FTDNA), while on 23andme I get 2nd cousin and 3rd to distant cousin predictions.  The centimorgan totals that I show with my matches reach as high as 369cM on FTDNA, and 161cM on 23andme.  For my mother, 693cM on FTDNA and 376cM on 23andme.  I see the same happening with Maoris, ranging between 300cM – 700cM (FTDNA) for the top 20 people.  And for a non-admixed Hawaiian, their top matches are in the 600 – 700cM range.   An admixed Polynesian would logically have lower totals. But even an admixed person can still have a fairly high amount of totals shared, as when I am comparing myself being less than half Hawaiian.

When comparing two Tongans, the highest that they shared was 335cM.   A Samoan compared to another Samoan was 366cM.  And both of these Tongans and Samoans had their remaining top matches in the range of 100cM to 200cM.  Many of their matches are the same Hawaiians and Maori that match each other at a much higher total.  It is amazing to see these autosomal matches and how diverse the western Polynesians are, or rather how Hawaiians and Maoris are not as diverse.  And even if it is an admixed Hawaiian or Maori, the matches to each other are still pretty high, and as high as what non-admixed western Polynesians would have to each other.

When comparing the longest block (largest segment) with Tongans and Samoans, they seem to rarely get close to 15cM, averaging around 10cM.  Anything more than that could indicate a possible closer relationship or perhaps a specific common geographic origin.  The Hawaiians and Maoris usually range between 10cM – 15cM for the largest segment, but can go as high as 28cM which is usually in admixed Hawaiians and Maoris compared to each other.  In other words, all Polynesians in general will have high totals exceeding 100cM, but whose largest segment rarely exceeding 10cM.

I look forward to more western Polynesians getting tested so we can see if there is any pattern to specific islands in their own island group, something I have been trying to do with Hawaiians with the few haplogroups that there are for Polynesians.  What also needs to be analyzed are people from Tahiti and the Marquesas being that they were key dispersal points for eastern Polynesians.  I managed to only see the results of one admixed Tahitian woman and her match totals are identical to mine when comparing totals.  I am curious to find out what non-admixed Tahitians will show, if it is more identical to eastern Polynesians, or to western Polynesians.

Small segments on the X; male vs. female

Kitty Cooper put out a blog post where she entitled it What Can the X Chromosome Tell Us About the Importance of Small Segments? by Kathy Johnson.   Kathy Johnson had gone through the males in her project and began analyzing and compared to females, determining how much of the females were producing false positives vs. the men.  Because not many men would get a lot of X-matches.  This seems to be an ongoing investigation with various people blogging about the validity of phasing, or rather how effective if not necessarily is it to weed out any false positive matches. It seems to be based on FamilyTreeDNA’s X-matches where they include many tiny segments as little as 1cM.  And the more substantial matches with 10cM or more tends to reduce the actual X-matches significantly, which would be due to the lack of phasing.  You can read more about it on Kitty’s blog, although most of the discussion about evaluating all of these matches took place outside of the blog and on Facebook’s “International Society of Genetic Genealogy” page.

That made me curious, because others have expressed how some men had little to no X-matches.  This was not my situation at all , and went through my list of 9 pages on FTDNA and counted 47 X-matches out of the total 89 matches that I have.  I noticed that one of them was actually an X match on my father’s side of matches, a Filipino.  I knew that was wrong.  So when I looked at it, no X match showed up in the chromosome browser until I reduced the threshold down to 1+cM where I saw a 1.9cM, a false match.

Aside from one woman mislabeled as a male in my matches, I actually have 20 men and 26 females as X-matches, not counting that Filipino false match.  That’s half of my matches.  My mother has 93 X-matches out of her 159 matches, so not that much more than me.  Could that indicate that my mother’s X-matches are more, or less of false matches?  It’s an interesting idea to see how men can have less false matches but we are looking at Polynesian matches which just adds something else to it.

I know that I do have a lot of my matches below 5cM on the X chromosome, so I used dnagedcom.com’s ADSA (autosomal DNA segment analyzer) to at least look at my ICW (in common with) matches on the X, but I had increased the threshold to 700SNPs and 10cM.

Screen Shot 2014-12-20 at 12.30.11 PM

I was thinking that not only would it be easier to use this tool by instantly seeing my X-matches above a specific threshold, but it would also compare me with others with whom we share the same segments, therefore decreasing the chances of false matches.  But taking into consideration that we are referring to Polynesians.  How would that affect it really?

I cannot determine from comparing my own to my mother’s X-matches if they would be false matches or not. Our problem, lack of documentation, lack of genetic diversity and the unpredictability of the X chromosome itself just to mention a few.

I have recently begun testing my first cousins on my non-Hawaiian side in order to take a closer look at the X chromosome and how that is passed on knowing the X path, that is how it is passed on unrecombined from father to daughter versus mother to children.  I also felt that knowing how it is passed on, it would be easier to distinguish which part of the chromosome was inherited from my grandfather versus my grandmother.  And not until I begin testing relatives from each of my grandparents’ side, I will not be able to fully distinguish all of them with the rest of the other 22 pairs of chromosomes.

Having said that, I cannot see how these X-matches, at least among Polynesians would be consist of a lot of false segments or not.  Especially when there are long segments with the more distant people, e.g., Maoris or Samoans and Tongans, of which I do have X matches with.  But the Samoans and Tongans are not included in the ICW due to the fact that I increased the threshold to exclude anything below 10cM.

I also used Gedmatch’s ONE TO MANY to get all my matches, sorted them by the largest segment on the X and just looked at how many were above 10cM.  There were only 20.

Screen Shot 2014-12-20 at 8.21.57 PM

I did the same for my brother, he got 17 above 10cM.  I also looked at other Polynesian men just to compare and the numbers varied, usually not exceeding 20 with 10cM minimum threshold.  It is still all interesting although it is hard to decipher how much of it is true for Polynesians.  Hopefully as more Polynesians get tested, we will start to notice more differences, or confirm that we just all have a high amount of X-matches.

Polynesia Category – AncestryDNA.com

Earlier this year I tested with Ancestry.com (or AncestryDNA.com) since I’ve been noticing non-Polynesians coming up with this new category.  This is way after the fact the research does not specify a Polynesia component, but rather a Melanesian and Asian or East Asian or Southeast Asian component.  I have seen other Asians, specifically Filipinos coming up with decent amount of this Polynesia category, as well as those of European descent coming up with small traces of Polynesia.

Under their Polynesia category, it mentions the sampling size was 18, and that one of the samples showed 11% Scandinavian.  A larger sampling size would yield better results especially in this case where one of the 18 samples had some European admixture.  This was enough to cause those with Scandinavian ancestry to come up with small traces of Polynesia, and in return cause people to wonder how they could have ever had such ancestry in their lineage to a point where some people create possible scenarios how they could have inherited this less than 0.1% Polynesia.

Screen Shot 2014-12-15 at 9.07.24 AM


Their Polynesia category was one of those categories where they had the least amount of samples.

Screen Shot 2014-12-15 at 9.42.16 AM

After receiving my results, as I suspected due to the fact that I am half Filipino, my percentage of the Polynesia category was pretty inflated.  It showed that I had 57% Polynesia versus 34% Asia East.  Knowing that my mother is 80% Hawaiian, and that my father was pure Filipino, I figured the amount of Asia that I showed 34% was missing 16% that was thrown into the Polynesia category.  That would in turn leave me with 41% Polynesia.  My mother is 20% European, and according to Ancestry I am 8% Europe, which seems to be about right.  The other DNA companies I tested at showed more than 10% Europe.  But adding the 41% plus the 8% comes out about right, 49%.

Recently I had a cousin on my father’s side of the family test, and she got her results.  She too is half Filipino, while her other half is completely Europe.  I expected her to show some Polynesia but I did not even guess how much that would be.  I was surprised to see 16% Polynesia for her, which is the same amount I had deducted from my own.  In fact, she shows 33% Asia while I show 34% Asia, and more specifically we both share 31% Asia East.  So they both are consistent.

Screen Shot 2014-12-15 at 9.03.53 AM

Although my mother was given an AncestryDNA kit, she has yet to take it.  But I can easily guess that she will easily show 20% Europe and 80% Polynesia.  Any other person who is Polynesian but admixed with some other Asian it may include part of their Asian component into Polynesia.  Maybe the fact that we are Filipinos and they have ancestral ties is why some of it is classified as such.  I did have another paternal cousin tested, she is half Filipino and half Japanese so not sure what type of results that will yield with the Polynesia category.  Will it be the same and show her as 16% Polynesia?  Or will it give her more due to her Japanese ancestry, or is that different enough to not be classified under the Polynesia category?

To find out more about AncestryDNA’s ethnicity/ancestry categories, you can read through their Ethnicity Estimate White Paper.

Polynesian mtDNA in Botocudo of Brazil

Back in mid-September Roberta Estes had a blog entry Native American Mitochondrial Haplogroups.  It’s basically a list of mitochondrial haplogroups that exists among Native Americans.  But what caught my eye was the Polynesian motif – B4a1a1.  She wrote, “B4a1a1 – found in skeletal remains of the now extinct Botocudos (Aimores) Indians of Brazil, thought to perhaps have arrived from Polynesia via the slave trade.  This haplogroup is found in 20% of the mtDNA of Madagascar. Goncalves 2013” and “B4a1a1a – found in skeletal remains of the now extinct Botocudos (Aimores) Indians of Brazil, thought to perhaps have arrived from Polynesia via the slave trade.  This haplogroup is found in 20% of the mtDNA of Madagascar. Goncalves 2013.”   And although there is the actual research out there, it started with an article back in April 2013 titled, “DNA study links indigenous Brazilians to Polynesians.”  Although the article’s title itself only mentions a link, it can be confusing to the reader and can be misleading once you begin reading through it.

The article quoted Lisa Matisoo-Smith, a molecular anthropologist at the University of Otago in Dunedin, New Zealand where she said, “But to call that haplogroup Polynesian is a bit of a misnomer,”  since the haplogroup is known to be in populations as far west as in Madagascar.  The actual research can be found here, Identification of Polynesian mtDNA haplogroups in remains of Botocudo Amerindians from Brazil. It basically says that “Here we report the identification of mitochondrial sequences belonging to haplogroups characteristic of Polynesians in DNA extracted from ancient skulls of the now extinct Botocudo Indians from Brazil.”   She does not seem to have been referring to the actual Polynesian motif but the fact that the research cited the mutations that is defined as the Polynesian motif.

The paper questions how did the presence of a Polynesian mtDNA show up in the gene pool of an extinct Brazilian Amerindian group who lived in the interior of Brazil?  There are specific mutations occurring on the mitochondrial which identifies it as the Polynesian motif,  and considering the evolutionary history of the Polynesian motif which is associated with the Austronesian expansion and the settling of Polynesia being much more recent than the peopling of the Americas.  Why hypothesizing how the introduction of the Polynesian motif could have entered into South America, the article says in part, “….considering an ancient Paleoamerican origin of the Botocudo haplotypes, we should expect new ‘private’ mutations to have appeared.  On the other hand, because we did not sequence the whole mtDNA, we cannot rule out the existence of such variations in the coding region.”

What is interesting to note is that is it not certain that these two skulls that they have analyzed were actual Polynesians or not. That is due to the fact that there was never a full sequencing test done on those two skulls that came up with the mutations that indicate the Polynesian motif.  Instead, only HVR1, HVR2 and typed specific mutations on the coding region were sequenced.  The findings mention specifically:  6719C, 15746G, 14022G and 12239T. These specific mutations on the coding region not only exists in my own mtDNA results (B4a1a1a3, now known as B4a1a1c) but so does a friend of mine who is identified as having the Malagasy motif. The paper already mentioned how these two skulls could have come back with such a haplogroup is possibly through the slave trade, originally from Madagascar.  And there were trips originating from Madagascar that eventually took these slaves into Brazil.

So the real question is were these two skulls the result of that recent slave trade originating from Madagascar, or did somehow a very few handful of Polynesians made their way all the way to Brazil?  The Botocudos lived in the interior portion of the state of Minas Gerais, so very far from the Pacific Ocean.

Lisa Matisoo-Smith  said it best, that to call that haplogroup Polynesian is a bit of a misnomer, particularly because we know it also exists in the Philippines and the subgroup – B4a1a1b (Malagasy motif) is in Madagascar.  Until a full sequencing test is done, there still may be some debate as to whether or not Polynesians have gone that far into the interior of South America, or that these skulls were the descendants of Malagasy brought over during the slave trade.